
11. tbl. 101. árg. 2015
Fræðigrein
Effect of cardiac rehabilitation following coronary bypass surgery or other coronary interventions
Áhrif hjartaendurhæfingar HL-stöðvarinnar eftir kransæðahjáveituaðgerð eða annað kransæðainngrip
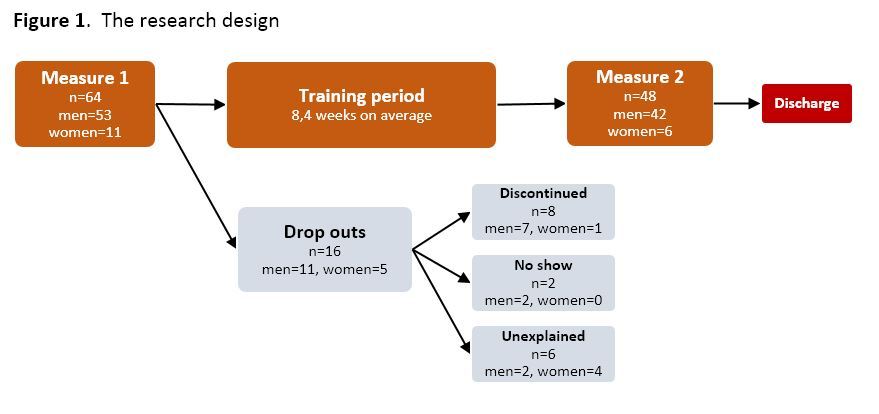
Material and methods: Patients that had undergone coronary artery intervention were invited to participate. There were 64 participants (of 65 invited) that started in the study and 48 that finished. On average participants attended 2.1 sessions pr. week, for 8.4 weeks. Measurements performed: endurance (W/kg), blood pressure and pulse responses from an exercise test and body mass index (kg/m2). To measure health related quality of life the SF-36v2 questionnaire was used.
Results: Endurance improved by 14.4% (p<0,001) and a 6.1% increase was seen in peak pulse (p=0.001). The group was divided by age (32-64 years and 65-86 years) and both age groups improved their endurance number similarly (14.6% and 14.1%) but only the older age group improved peak pulse significantly or 7.2% (p=0.007). When the group was divided according to number of training sessions per week there was a 10.1% increase in endurance in the group that had fewer sessions but it was 19.8% in those that attended more sessions (p<0.001). Participants assessed that their physical health, measured with a questionnaire, had improved at the end of training (p=0.003). When the group was divided into two groups according to how they measured their physical health at the beginning of the study there was a significant increase of 15.1% in physical health in those that estimated worse quality of life at the beginning of the study, but the other group had an increase of 1.2%.
Conclusion: Cardiac rehabilitation improves endurance and physical wellbeing in patients. Training magnitude is essential for improvement.
Table I. Descriptive characteristics.
| Lowest value | Highest value | Mean | |
| Number of weeks of training | 5.0 | 20.9 | 8.4 |
| Training sessions (per week) | 0.4 | 3.0 | 2.1 |
| Age (years) | 32 | 86 | 65 |
| Height (cm) | 160 | 192 | 177 |
| Weight (kg) (Measure 1) | 54 | 141 | 89,8 |
| Weight (kg) Measure 2) | 54 | 140 | 89,5 |
| Body mass index (kg/m2) (Measure 1) | 21 | 44 | 29 |
| Watts (Measure 1) | 75 | 250 | 149 |
| Watts (Measure 2) | 90 | 288 | 169 |
| Women | Men | Total | |
| Gender distribution of participants | 6 (12.5%) | 42 (87.5%) | 48 |
Table II. Measurement at baseline and after the training period.
| n | Baseline | After training period | Difference | Difference (%) | p-value | |
| Endurance (W/kg) | 48 | 1.7 ± 0.5 | 1.9 ± 0.5 | 0.2 ± 0.2 | 14.4 | <0.001 |
| 32-64 years | 23 | 1.8 ± 0.5 | 2.1 ± 0.6 | 0.3 ± 0.2 | 14.6 | <0.001 |
| 65-86 years | 25 | 1.5 ± 0.4 | 1.7 ± 0.4 | 0.2 ± 0.2 | 14.1 | <0.001 |
| Body mass index, kg/m2 | 48 | 28.6 ± 4.5 | 28.5 ± 4.4 | -0.1 ± 0.6 | -0.4 | 0.251 |
| Resting pulse rate | 48 | 67.7 ± 10.9 | 65.5 ± 11.7 | -2.2 ± 8.9 | -3.2 | 0.095 |
| Peak pulse rate | 48 | 125.2 ± 22.0 | 132.7 ± 21 | 7.6 ± 14.5 | 6.1 | 0.001 |
| 32-64 years | 23 | 135.5 ± 20.2 | 142.2 ± 19.8 | 6.7 ± 14.9 | 5.0 | 0.041 |
| 65-86 years | 25 | 115.6 ± 19.4 | 124.0 ± 18.3 | 8.4 ± 14.3 | 7.2 | 0.007 |
| Systolic (min) | 48 | 129 ± 20 | 133 ± 21 | 4.3 ± 20.6 | 3.4 | 0.150 |
| Diastolic (min) | 48 | 83 ± 12 | 83 ± 10 | -0.7 ± 11.6 | -0.8 | 0.684 |
| Systolic (max) | 48 | 183 ± 25 | 186 ± 27 | 3.4 ± 21 | 1.9 | 0.269 |
| Diastolic (max) | 48 | 95 ± 11 | 94 ± 14 | -0.1 ± 11 | -0.1 | 0.937 |
Value: Average ± standard deviation
Table III. Physical measurements and number of training sessions.
| 0.4 – 2.1 training sessions (n=25) | 2.2 – 3.0 training sessions (n=23) | |||||||
| Baseline | After training period | Difference (%) |
p-value | Measure 1 | Measure 2 | Difference (%) |
p-value | |
| Endurance (W/kg mean) | 1.8 ± 0.5 | 2.0 ± 0.5 | 10.1 | <0.001 | 1.5 ± 0.4 | 1.8 ± 0.5 | 19.8 | <0.001 |
| Body mass index, kg/m2 | 28.3 ± 4.4 | 28.3 ± 4.4 | 0.0 | 0.932 | 29.0 ± 4.8 | 28.7 ± 4.5 | -0.8 | 0.112 |
| Resting pulse rate | 68.0 ± 10.1 | 64.8 ± 10.1 | -4.7 | 0.080 | 67.2 ± 12 | 66.1 ± 13.4 | -1.6 | 0.574 |
| Peak pulse rate | 129.9 ± 19.1 | 132.3 ± 18.1 | 1.8 | 0.323 | 120.0 ± 24.1 | 133.2 ± 24.1 | 11.0 | <0.001 |
| Systolic (min) | 133 ± 22 | 134 ± 19 | 0.7 | 0.786 | 124 ± 17 | 132 ± 23 | 6.5 | 0.119 |
| Diastolic (min) | 84 ± 11 | 81 ± 9.1 | -3.8 | 0.236 | 82 ± 13 | 84 ± 11 | 2.5 | 0.275 |
| Systolic (max) | 188± 30 | 187 ± 30.2 | -0.3 | 0.877 | 177 ± 17 | 184 ± 22 | 4.4 | 0.113 |
| Diastolic (max) | 95 ± 12 | 91 ± 10.0 | -4.1 | 0.073 | 94 ± 10 | 98± 16 | 4.2 | 0.080 |
Value: Average ± standard deviation
Table IV. Health quality of life - SF-36v2.
| n1 | Measure 1 | Measure 2 | Difference | Difference (%) | p-value | |
| Physical health (PCS)3 | 41 | 47.7 ± 7.1 | 51.2 ± 6.5 | 3.4 ± 6.9 | 7.2 | 0.003 |
| 0.4 - 2.1 sessions | 21 | 48.7 ± 7.7 | 51.5 ± 6.3 | 2.9 ± 7.3 | 5.9 | 0.090 |
| 2.2 - 3.0 sessions | 20 | 46.8 ± 6.6 | 50.8 ± 6.9 | 4.0 ± 6.6 | 8.6 | 0.014 |
| Worse initial health2 | 20 | 42.1 ± 5.1 | 48.4 ± 6.2 | 6.4 ± 7.9 | 15.1 | 0.002 |
| Better initial health2 | 21 | 53.1 ± 3.7 | 53.8 ± 5.9 | 0.6 ± 4.4 | 1.2 | 0.523 |
| Mental health (MCS)4 | 41 | 52 ± 8 | 53.1 ± 7.3 | 1.1 ± 7.2 | 2.2 | 0.314 |
| 0.4 - 2.1 sessions | 21 | 54.3 ± 5.6 | 55.4 ± 6.1 | 1.1 ± 6.4 | 2.0 | 0.446 |
| 2.2 - 3.0 sessions | 20 | 49.5 ± 9.4 | 50.7 ± 7.8 | 1.2 ± 8.1 | 2.4 | 0.515 |
| 1 41 of 48 answered both questionnaires adequately. | ||||
| 2 Self estimate on physical health is divided into two categories 1) score 29-47 and 2) score 48-60. Higher number means better health. | ||||
|
3 PCS: Physical component summary. 4 MCS: Mental component summary. |
||||