
09. tbl. 101. árg. 2015
Effects of rehabilitation on functional capacity, obesity and health behavior, among cardiac patients with DM2
Objective: Present study examines the prevalence of type 2 diabetes (DM2) in patients attending cardiac rehabilitation (CR) compared to the general population utilising data from the Icelandic Heart Association population study. The study also examined the efficacy of CR for promoting health behaviors.
Material and methods: A prospective study among DM2 patients attending CR at Reykjalundur Rehabilitation centre. The DM2 group was compared to other cardiac patients, with respect to obesity and exercise capacity at the beginning and end of 4-6 weeks of CR. Additionally, in the DM2 group, weight, smoking cessation, physical activity and walking capacity were assessed at 3 and 6 months follow-ups.
Results: The prevalence of DM2 was 2-4 times higher in CR participants than in the general population. Compared to other CR participants, the DM2 group was heavier, with increased waist circumference and less exercise capacity. During the CR both groups lost weight and waist circumference decreased to similar extent, but the exercise capacity increased less in the DM2 group. In follow up after 6 months the DM2 group´s weight and glucose values were back to same level as before CR, but waist circumference was still decreased and they retained increased physical activity and walking capacity.
Conclusion: DM2 is more prevalent among patients in cardiac rehabilitation than in the general population. The DM2 group was more obese, had lower exercise capacity and responded somewhat less to CR than other cardiac patients. Follow up after 6 months did however show that they continued their regular exercise and walking capacity was still retained.
Table I. Baseline characteristics of cardiac patients with and without DM2 at the start of rehabilitation, and the ratio of patients with coronary heart disease or heart failure.
| With DM2 | Without DM2 | |
| Number=292, n (%) | 56 (192) | 236 (81.8) |
| Cardiac rehabilitation, weeks | 4.4 ± 0,9 | 4.3 ± 0.8 |
| Age, years | 62.4 ± 9.3 | 59.6 ± 12.5 |
| Sex ratio, male/female | 42/14 | 172/64 |
| Weight, kg | 100.4 ± 18.5 | 90.3 ± 21.4 ** |
| BMI, kg/m² | 33.2 ± 5.9 | 30.0 ± 6.5 ** |
| Obesity (BMI ≥ 30), n [ratio, %] | 35 [63] | 102 [43] * |
| Waist circumference, cm | 113.8 ± 13.5 | 104.4 ± 17.0 ** |
| Peak work load, W | 119.6 ± 37.1 | 122.2 ± 39.8 |
| Peak exercise capacity, W/kg | 1.20 ± 0.29 | 1.39 ± 0.47 ** |
| Fasting s-blood glucose, mmol/L | 6.94 ± 1.66 | 4.94 ± 0.62 ** |
| s-triglycerides, mmol/L | 1.61 ± 0.73 | 1.25 ± 0.62** |
| s-HDL, mmol/L | 1.19 ± 0.73 | 1.25 ± 0.35 |
|
Patients with coronary heart disease, n Ratio of patient group, % |
47 84 |
161* 68* |
|
Patients with heart failure, n Ratio of patient group, % |
2 3.6 |
12 5.1 |
BMI =body mass index. Average ± standard deviation; *p<0.05 between groups, **p<0.005 between groups
Table II. Data from patients with DM2 in cardiac rehabilitation (CR); before and after CR, and at follow up visits after 3 and 6 months.
| Before CR | After CR |
Follow up 3 months |
Follow up 6 months |
|
| Number, n [%] | 56 [100] | 54 [96] | 49 [88] | 46 [82] |
| Weight, kg | 100.4 ± 18.5 | 98.5 ± 17.6* | 99.5 ± 17.2 | 99.7 ± 17.9 |
| BMI, kg/m2 | 33.2 ± 5.9 | 32.6 ± 5.6* | 32.8 ± 5.7 | 33.0 ± 6.1 |
| Waist circumference, cm | 113.8 ± 13.5 | 111.3 ± 13.2* | 111.2 ± 12.4* | 110.8 ± 13.1* |
| Body fat, % | 33.8 ± 6.7 | 33.0 ± 7.0* | 33.7 ± 6.1 | 33.7 ± 6.5 |
|
6 min walking test Distance, m Number, n |
512 ± 96 55 |
546 ± 100 * 53 |
537 ± 96 * 43 |
525 ± 107 * 38 |
| Fasting s-glucose, mmol/L | 6.9 ± 1.7 | 6.3 ± 1.1* | 6.8 ± 1.5 | 7.1 ± 1.9 |
| HbA1c, % | 6.7 ± 1.1 | 6.7 ± 1.0 | 6.8 ± 1.0 | |
| s-Triglycerids, mmol/L | 1.6 ± 0.7 | 1.6 ± 0.8 | 1.6 ± 0.7 | |
| s-HDL, mmol/L | 1.2 ± 0.7 | 1.2 ± 0.3 | 1.2 ± 0.4 | |
| Smoking yes/no | 5/51 | 2/54 | 2/47 | 1/45 |
BMI=Body Mass Index. Averages ± standard deviation. *p<0.05 comparison to measurement data before CR.
Table III. Antidiabetic drug treatment during the study period.
| Before CR | After CR |
Follow up 3 months |
Follow up 6 months |
|
| Number, n [%] | 56 [100] | 54 [96] | 49 [88] | 46 [82] |
| No antidiabetic drugs | 7 | 5 | 4 | 3 |
| Antidiabetic drugs: | ||||
| Metformin | 44 | 44 | 41 | 39 |
| Sulfonylurea drugs | 18 | 19 | 17 | 15 |
| Other antidiabetic drugs | 4 | 4 | 4 | 5 |
| Insulin treatment | 13 | 12 | 10 | 9 |
| Insulin, IU | 74 ± 49 | 62 ± 40 | 61 ± 42 | 57 ± 44 |
Observe that the sum of each column can be higher than the total number of patients as some of them are on more than one drug.
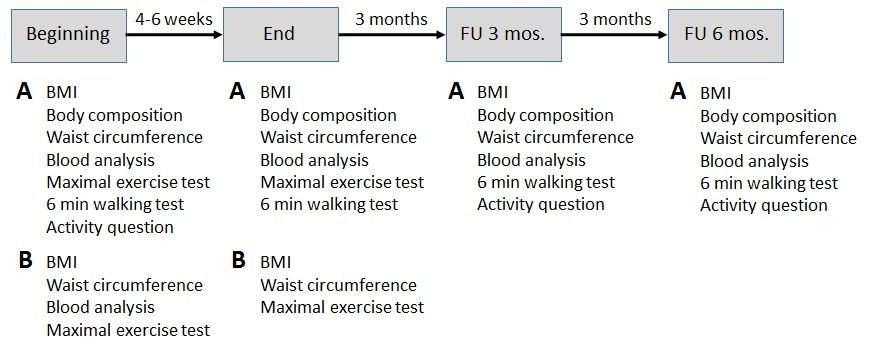
Figure 1. Measurements done in the beginning and at the end of cardiac rehabilitation (CR) and in follow up visits after 3 and 6 months. A Measurements done on cardiac patients with DM2 (the study group). B Measurements done on all patients in CR during the study period and used for comparison to the study group.
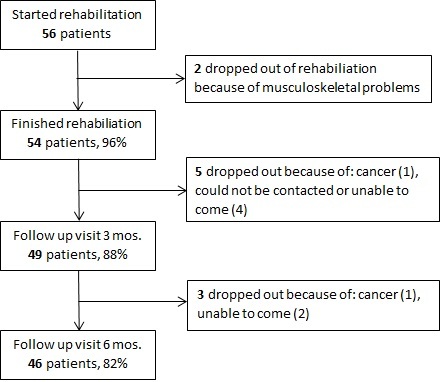
Figure 2. Attendance and drop-out among cardiac patients with DM2 (the study group) during the study period.
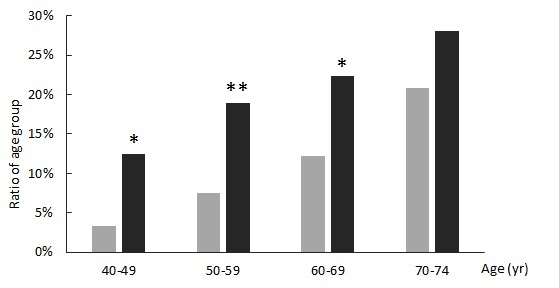
Figure 3. Comparison of the prevalence of DM2 after age groups in men, utilising data from the Icelandic Heart Association (IHA) population study (light columns) and those coming for cardiac rehabilitation in Reykjalundur (dark columns).
*p< 0.05 Reykjalundur vs IHA, for that age group; **p<0.01Reykjalundur vs. IHA, for that age group.
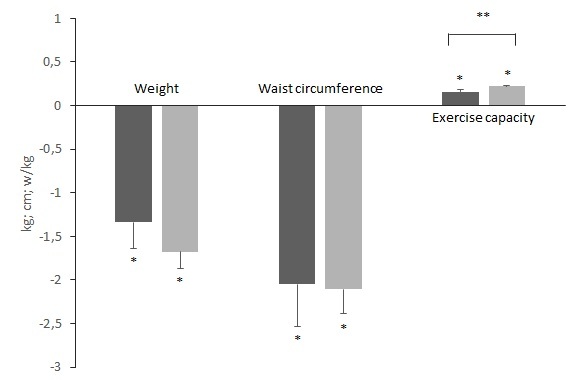
Figure 4. Changes during rehabilitation in weight, waist circumference and exercise capacity in cardiac patients with (dark columns) and without (light columns) DM2. The columns show averages and SD. *p<0,0001 for changes in each group. **p<0,05 for comparison on changes between the patient groups.
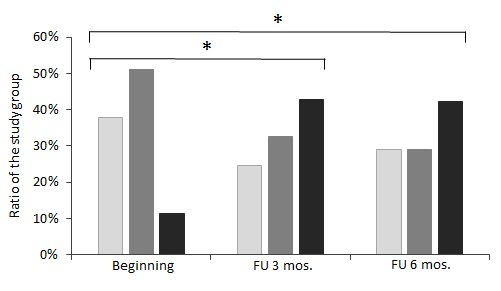
Figure 5. Results from a question on exercise and physical activity at the beginning of CR and at follow up visits 3 months (FU 3 mos.) and 6 months (FU 6 mos.) after CR. Physical activity 1 (light grey columns) is mainly inactivity, physical activity 2 (medium grey columns) is light physical activity for a minimum of two hours per week, and physical activity 3-4 (dark columns) is moderate to intensive physical activity for minimum of two hours per week.
*p<0.001 in comparison to beginning of CR.