
02. tbl. 101. árg. 2015
Prevalence of diabetes as well as general health status of Icelandic nursing home residents 2003-2012
Algengi sykursýki og heilsufar íbúa á íslenskum hjúkrunarheimilum 2003-2012
Introduction: Diabetes is an increasing problem among old people as well as being a contributing factor in their need for institutional care. Comorbidity and use of medication is often greater among people with than without diabetes. The aim of this study was to investigate the prevalence of diabetes in Icelandic nursing homes over the period 2003-2012. Additionally we compared health, functioning, medication use and medical diagnoses of residents with diabetes to those without diabetes, living in nursing homes in 2012.
Material: Retrospective study of 16.169 Minimum Data Set 2.0 assessments, further analysis conducted for data from the year 2012 (n=2337).
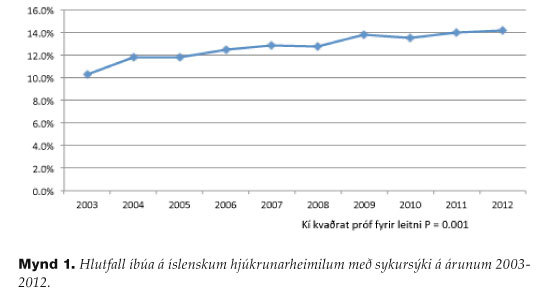
Results: Mean age from 82.3 (SD 9.1) to 85.0 years (SD 8.4) and women were 65.5% to 68.0%. Number of residents with diabetes increased from 10.3% in the year 2003 to 14.2% in 2012 (p≤0,001). Mean age of residents with diabetes in the year 2012 was 82.7 compared to 85 years for others. Residents with diabetes had more skin problems, used more medication, their cognitive performance was better and their involvement in activities greater. They were more likely to have hypertension, arteriosclerotic heart disease, stroke, renal failure, manic depressive disorder, diabetic retinopathy or amputation. They were however, less likely to have an anxiety disorder, Alzheimer's disease or osteoporosis.
Conclusion: Residents with diabetes are younger than other residents and their cognitive performance is better, their care and treatment may however be complicated and needs to be adapted to each individual. Diabetes is an increasing problem in nursing homes and therefore an area where more knowledge among staff is needed.
Prevalence of diabetes and health status of Icelandic nursing home residents 2003-2012
Table I. Number of assessments each year and the characteristics
of the sample.
| Year | n | % | Mean age (SD) | Women n (%) |
| 2003 | 447 | 2,8 | 82,3 (9,1) | 293 (65,5) |
| 2004 | 1001 | 6,2 | 82,8 (8,5) | 677 (67,6) |
| 2005 | 1383 | 8,6 | 83,4 (8,2) | 922 (66,7) |
| 2006 | 1721 | 10,6 | 84,4 (7,9) | 1149 (66,8) |
| 2007 | 1922 | 11,9 | 84,4 (7,9) | 1268 (66,0) |
| 2008 | 1885 | 11,7 | 84,7 (8,2) | 1247 (66,2) |
| 2009 | 1867 | 11,5 | 84,9 (8,2) | 1223 (65,5) |
| 2010 | 1754 | 10,8 | 85,0 (8,4) | 1192 (68,0) |
| 2011 | 1852 | 11,5 | 84,5 (8,6) | 1232 (66,5) |
| 2012 | 2337 | 14,5 | 84,7 (8,2) | 1531 (65,5) |
| Total | 16169 | 100 | 84,2 (8,4) | 11.294 (66,3) |
Picture 1. Residents in Icelandic nursing homes (%) with diabetes over the years 2003-2012
| Table II. Gender, age, health, functional profile and medication use of residents with and without diabetes living in Icelandic nursing homes in the year 2012. | |||
| With diabetes | Without diabetes | P | |
| N=2337 n (%) | 332 (14,2) | 2005 (85,8) | |
| Females (%) | 204 (61,4) | 1327 (66,2) | 0,105* |
| Mean age (sf) | 82,7 (7,9) | 85 (8,2) | <0,001** |
| Body mass index (SD) | 27,1 (5,5) | 24,7 (5,9) | <0,001** |
| Health and functional profile | |||
| CHESS scale*** (SD) | 2,02 (1,42) | 2,02 (1,38) | 0,950** |
| Pain Scale mean (SD) | 1,15 (0,97) | 1,11 (0,96) | 0,510** |
| Depression Rating Scale mean (SD) | 2,71 (3,35) | 2,89 (3,28) | 0,370** |
| Cognitive Performance Scale mean (SD) | 3,11 (1,80) | 3,45 (1,79) | 0,001** |
| ADL Long Scale mean (SD) | 16,32 (8,75) | 17,07 (8,34) | 0,128** |
| Index of Social Engagement mean (SD) | 2,86 (2,06) | 2,51 (2,04) | 0,004** |
| Infections | |||
| Urinary tract infectionn (%) | 59 (17,8) | 257 (12,8) | 0,018* |
| Wound infectionn (%) | 10 (3,0) | 52 (2,6) | 0,799* |
| Pneumonia n (%) | 13 (3,9) | 89 (4,4) | 0,774* |
| Respiratory infection n (%) | 15 (4,5) | 72 (3,6) | 0,503* |
| Skin conditions | |||
| Rashes n (%) | 139 (41,6) | 685 (34,2) | 0,011* |
| Skin desensitized to pain n (%) | 112 (33,7) | 490 (24,4) | <0,001* |
| Ulcers stage 1-4 n (%) | 70 (21,1) | 345 (17,2) | 0,102* |
| Ulcers stage 1 n (%) | 36 (10,8) | 198 (9,9) | 0,656* |
| Ulcers stage 2 n (%) | 40 (12,0) | 180 (9,0) | 0,094* |
| Ulcers stage 3 n (%) | 7 (2,1) | 13 (0,6) | 0,019* |
| Ulcers stage 4 n (%) | 2 (0,6) | 6 (0,3) | 0,712* |
| Medications | |||
| Number of medications mean (SD) | 11,5 (4,23) | 9,6 (4,15) | <0,001** |
| Hypnotics (NO5C) %(n) | 48,5 (161) | 48,2 (967) | 0,976* |
| Antidepressants (NO6A) %(n) | 53,6 (178) | 55,1 (1105) | 0,654* |
| Antianxietymedication (NO5B) %(n) | 28,6 (95) | 31,5 (631) | 0,328* |
| Antipsychotics (NO5A) %(n) | 25,0 (83) | 27,2 (546) | 0,434* |
| Use of 9 or more medications n (%) | 255 (76,8) | 1150 (57,4) | <0,001* |
| *Chi square test; **T test; ***Changes in Health, End-stage disease and Signs and Symptoms Scale | |||
| Table III. Disease diagnoses of residents with and without diabetes living in Icelandic nursing homes in the year 2012. | |||
| With diabetes n (%) | Without diabetes n (%) | P* | |
| Hypertension | 230 (69,3) | 1111 (55,4) | <0,001 |
| Arthritis | 165 (49,7) | 1047 (52,2) | 0,428 |
| Depression | 142 (42,8) | 919 (45,8) | 0,327 |
| Arteriosclerotic heart disease | 124 (37,3) | 574 (28,6) | 0,002 |
| Dementia other than Alzheimer's | 118 (35,5) | 714 (35,6) | 1 |
| Anxiety disorder | 110 (33,1) | 797 (39,8) | 0,026 |
| Cerebrovascular accident | 89 (26,8) | 392 (19,6) | 0,003 |
| Cardiac dysrhythmias | 75 (22,6) | 497 (24,8) | 0,427 |
| Congestive heart failure | 73 (22,0) | 367 (18,3) | 0,13 |
| Alzheimer's disease | 64 (19,3) | 582 (29,0) | <0,001 |
| Osteoporosis | 62 (18,7) | 567 (28,3) | <0,001 |
| Cataracts | 53 (16,0) | 323 (16,1) | 1 |
| Renal failure | 48 (14,5) | 153 (7,6) | <0,001 |
| Other cardiovascular disease | 47 (14,2) | 295 (14,7) | 0,856 |
| Peripheral vascular disease | 26 (7,8) | 143 (7,1) | 0,733 |
| Manic depression | 26 (7,8) | 91 (4,5) | 0,016 |
| Diabetic retinopathy | 25 (7,5) | 2 (0,1) | <0,001 |
| Transient ischemic attack (TIA) | 16 (4,8) | 119 (5,9) | 0,496 |
| Amputation | 6 (1,8) | 11 (0,5) | 0,031 |
| Hypotension | 5 (1,5) | 74 (3,7) | 0,061 |
* Chi square test
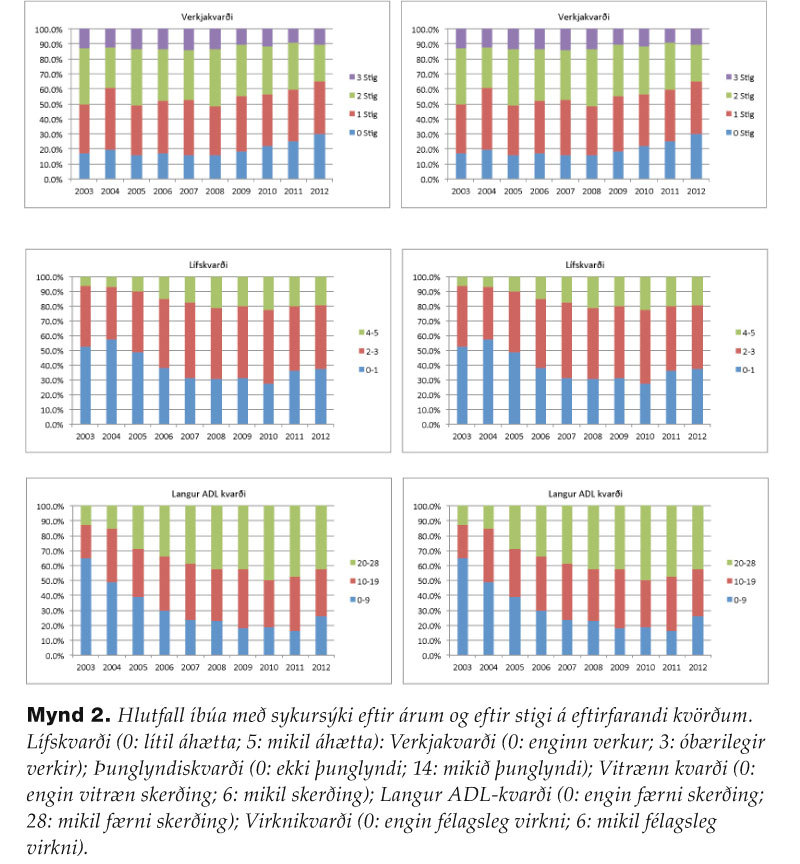
Figure 2. Percentage of residents with diabetes each year and scores for the following scales: Changes in Health, End-stage disease and Signs and Symptoms Scale (0: individual is stable; 5: highly unstable); Pain Scale (0: no pain; 4: excruciating pain); Depression Rating Scale (0: no depression; 14: severe depression); Cognitive Performance Scale (0: cognitively intact; 6: severe cognitive impairment); ADL Long Scale (0: independent; 28: severe impairment); Index of Social Engagement (0: severe withdrawal from social engagement; 6: much initiative and participation in social activities).