
12. tbl. 100. árg. 2014
Outcome of myocardial revascularisation in patients fifty years old and younger
Árangur kransæðahjáveituaðgerða hjá sjúklingum 50 ára og yngri
Introduction: Most patients that undergo coronary artery bypass grafting (CABG) are around 70 years of age when operated on. We investigated the outcome of CABG in patients 50 years and younger, focusing on early complications, operative mortality and long-term survival.
Material and method: A retrospective study on 1626 patients that underwent CABG in Iceland 2001-2012. One hundred patients aged 50 years or younger were compared to 1526 older patients.
Results: The male:female ratio, risk factors and extension of coronary artery disease were comparable in both groups, as was the proportion of patients with left main disease. Left ventricular ejection fraction was significantly lower in the younger patients (52 vs. 55%, p=0.004) and more of them had a recent myocardial infarction (41 vs. 27%, p=0.003). Minor complications were less common in the younger group (30 vs. 50%, p<0.001), especially new onset atrial fibrillation (14 vs. 35%, p<0,001). Chest tube bleeding for the first 24 hours postoperatively was also less in the younger group (853 vs. 999 ml, p=0.015) and they received fewer units of packed red cells (1.3 vs. 2.8 units, p<0.001). However, the incidence of major complications was comparable (6 vs. 11%, p=0.13) and the same was true for 30 day mortality (1 vs. 3%, p=0.5). Mean hospital stay was 2 days shorter for younger patients (p<0.001). There was a non-significant trend for improved disease-specific survival for the younger patients, or 99% vs. 95% 5-year survival (p=0.07).
Conclusion: In younger patients undergoing CABG minor complications are less common than in older patients, their hospital stay is shorter and transfusions less common. There was also a trend for improved disease specific survival for the younger patients.
Table I. Risk factors for coronary artery disease in younger and older patients. Number (%) except for body mass index, where means ± standard deviation (range) is presented.
| Risk factor |
Younger (≤50 years) |
Older (>50 years) |
p-value |
| History of smoking | 68 (69) | 1077 (72) | 0.74 |
| Dyslipidemia | 62 (63) | 855 (58) | 0.32 |
| Hypertension | 57 (57 | 981 (64) | 0.17 |
| Diabetes | 20 (20) | 241 (16) | 0.34 |
| Body mass index, kg/m2 (range) |
29.1 ±4.8 (21.2-46.3) |
28.1±4.4 (17-63.9) |
0.06 |
Table II. Operative data for patients in both groups. Number (%) or means with ±standard deviation (range).
|
Younger (≤50) |
Older (>50) |
p-value | |
| Off-pump surgery- |
28 (28) | 343 (22) | 0.32 |
| Skin-to-skin operation time, min (range) | 208 ±47(125-350) | 213±57(85-630) | 0.4 |
| Number of distal anastomosis (range) | 3.4 ± 1(1-5) | 3.4 ± 0.8(1-6) | 0.44 |
| Use of the left internal mammary artery- |
93 (93) | 1437 (94) | 0.26 |
Table III. Comparison of minor short-term complications between the younger and older groups. Number of patients (%).
| Short-term complications |
Young ≤50 yrs |
Older >50 yrs |
p-value |
| All minor complication |
34 (34)
|
763 (50)
|
<0.001
|
| Postoperative atrial fibrillation | 14 (14) | 590 (35) | <0.001 |
| Drainage of pleural effusion | 7 (7) | 180 (12) | 0.19 |
| Superficial wound infection | 7 (7) | 151 (10) | 0.48 |
| Urinary tract infection | 0 (0) | 55 (4) | 0.04 |
| Pneumonia | 7 (7) | 99 (6) | 0.83 |
| Acute kidney injury (RIFLE-stage R)* | 9 (9) | 145 (11) | 1 |
| Acute kidney injury (RIFLE-stage I)* | 1 (1) | 41 (3) | 0.51 |
*Creatinin values missing for two and 23 patients in the young and older groups, respectively.
Table IV. Comparison of major short-term complications between the younger and older groups. Number of patients (%).
| Short-term complications |
Young ≤50 yrs |
Older >50 yrs |
p-value |
| All major complications |
6 (6)
|
170 (11)
|
0.13
|
| Peroperative myocardial infarction | 3 (3) | 73 (5) | 0.62 |
| Sternal dehiscence | 1 (1) | 26 (2) | 1 |
| Periperative stroke | 0 (0) | 24 (2) | 0.4 |
| Multiorgan failure | 2 (2) | 52 (3) | 0.57 |
| Deep sternal wound infection (DSWI) | 0 (0) | 15 (1) | 1 |
| Acute kidney injury (RIFLE- stage F og E) | 0 (0) | 13 (0,8) | <0.001 |
*Creatinin values missing for two and 23 patients in the young and older groups, respectively
Table V. Cox proportional hazards model for overall mortality.
| HR | 95% CI | p-value | |
| Age ≤50 | 0.45 | 0.21 - 0,96 | 0.04 |
| Female gender | 1.11 | 0.81 - 1,53 | 0.50 |
| Diabetes | 1.54 | 1.12 - 2,11 | 0.008 |
| Emergent CABG | 2.93 | 1.80 - 4,77 | <0.001 |
| GFR <60 ml/min/1,73m2 |
2.42 |
1.82 - 3,22 | <0.001 |
| EF <30% | 2.81 | 1.52 - 5,20 | <0.001 |
*GFR; glomerular filtration rate, CI; confidence interval.
Figure 1. Proportion of patients that underwent elective, semiacute or emergent CABG in the younger (blue columns) or older group (green column).
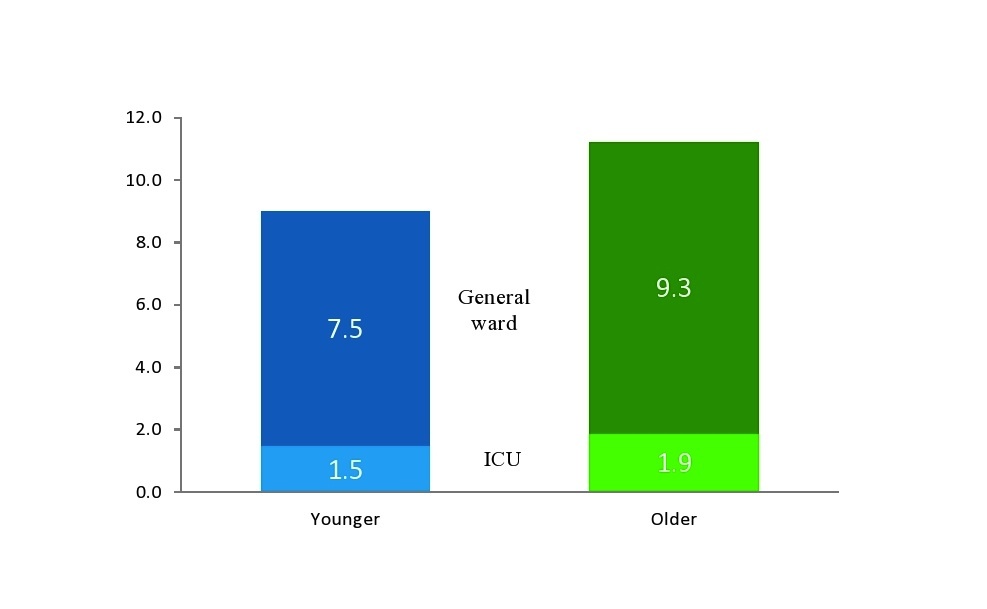
Figure 2. Postoperative hospital stay for younger (blue columns) and older patients (green columns), both in the intensive care unit and ward.
Figure 3. Overall (a), disease specific survival (b) for younger and older patients (Kaplan-Meier plot).Below the x-axis patiens at risk are shown.
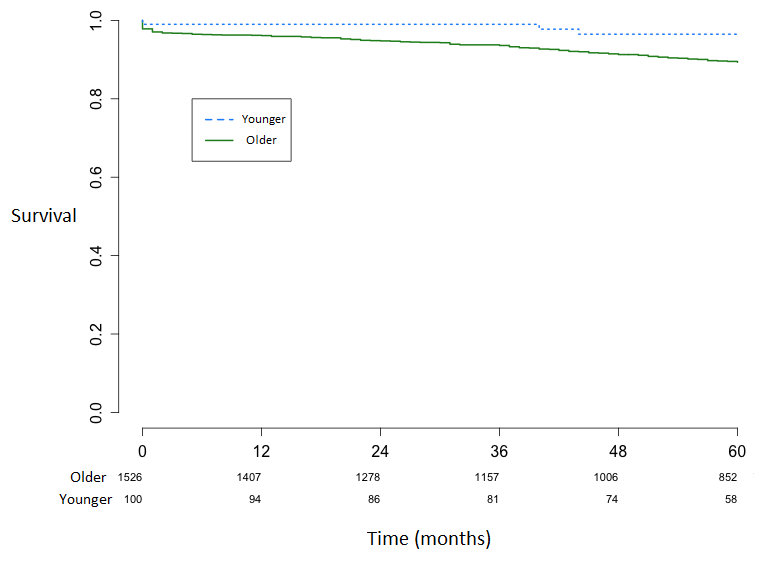