
10. tbl. 100. árg. 2014
Early outcome in diabetic patients following coronary artery bypass grafting
Snemmkominn árangur kransæðahjáveituaðgerða hjá sjúklingum með sykursýki
Materials and methods: A retrospective study of 1626 consecutive CABG patients operated in Iceland 2001-2012. Diabetic patients were 261 (16%) and were compared to 1365 non-diabetics in terms of patient demographics, operative data, and postoperative outcomes. Logistic regression was used to identify risk factors for major complications and 30-day mortality.
Results: The groups were similar in terms of age, gender and Euro-SCORE. Diabetic patients had a higher BMI (30 vs. 28 kg/m2, p<0.001), were more likely to have hypertension (82% vs. 60%, p<0.01) and glomerular filtration rate <60 ml/min/1.73m2 (22% vs. 15%, p=0.01). The rate of deep sternal wound infections, stroke and perioperative myo-cardial infarction was similar in both goups. Acute kidney injury, classified according to the RIFLE-criteria, was higher in diabetic patients, both in the RISK (14% vs. 9%, p=0.02) and FAILURE category (2% vs. 0.5%, p=0.01). Minor complications, (atrial fibrillation, pneumonia, urinary tract infections and superficial wound infections) were similar in both groups. 30-day mortality was 5.0% vs. 2% for diabetics and non-diabetics patients, respectively (p=0.01). Diabetes was not a significant risk factor for 30-day mortality when adjusted for other risk factors with logistic regression (OR=1.98, 95% CI 0.72-4.95).
Conclusions: Diabetic patients that underwent CABG more often suffered acute renal injury but diabetes was not an independent prognostic factor of operative mortality.
Table I. Comparison of age, gender and risk factors of coronary artery disease (univariate analysis). Number (%) except for age, EuroSCORE and BMI, where means with standard deviation are presented.
| Risk factor |
Diabetic n=261 |
Non-diabetic n=1365 |
p-value |
| Age, yrs. | 65 ± 9 | 66 ± 9 | 0.20 |
| Females | 49 (19) | 242 (18) | 0.75 |
| History of smoking | 54 (21) | 345 (25) | 0.16 |
| Dyslipidemia | 149 (57) | 767 (56) | 0.31 |
| EuroSCORE | 5 ± 3 | 4.6 ± 3 | 0.27 |
| Hypertension | 213 (82) | 824 (60) | <0.001 |
| BMI, kg/m2 | 30 ± 5 | 28 ± 4 | <0.001 |
Table II.Comparison of minor short-term complications. Number of patients (%).
|
Diabetic n=261 |
Non-diabetic n=1365 |
p-value | |
| Atrial fibrillation | 91 (35) | 459 (34) | 0.75 |
| Superficial wound infection | 28 (11) | 130 (9) | 0.61 |
| Urinary tract infection | 11 (4) | 44 (3) | 0.52 |
| Drainage of pleural effusion | 33 (13) | 154 (11) | 0.58 |
| Pneumonia | 15 (6) | 91 (7) | 0.68 |
Table III. Comparison of major short term complications and postoperative hospital stay. Number of patients (%).
|
Diabetic n=261 |
Non-diabetic n=1365 |
p-value | |
| Perioperative myocardial infarction | 11 (4) | 65 (5) | 0.82 |
| Perioperative stroke | 5 (2) | 19 (1) | 0.57 |
| Deep sternal wound infection | 4 (2) | 11 (1) | 0.28 |
| Sternal dehiscence | 7 (3) | 20 (1) | 0.18 |
| Acute kidney injury (RIFLE stage F) | 11 (2) | 14 (0.5) | 0.01 |
| Length of hospital stay, days | 13 ± 9 | 11 ± 5 | 0.02 |
Table IV. Multiple logistic regression for significant risk factors for 30 day mortality.
| Odds Ratio (OR) |
95% CI | p-value | |
| Age | 1.13 | 1.07-1.20 | <0.001 |
| BMI, kg/m2 | 1.01 | 0.92-1.10 | 0.82 |
| GFR<60 ml/min/1.73m2 | 2.63 | 1.18-5.84 | 0.02 |
| EF < 30% | 6.74 | 1.32-2.58 | 0.01 |
| Hypertension | 0.82 | 0.36-1.94 | 0.63 |
| Emergent CABG | 13.24 | 5.25-32.05 | <0.001 |
| Diabetes | 1.98 | 0.72-4.95 | 0.16 |
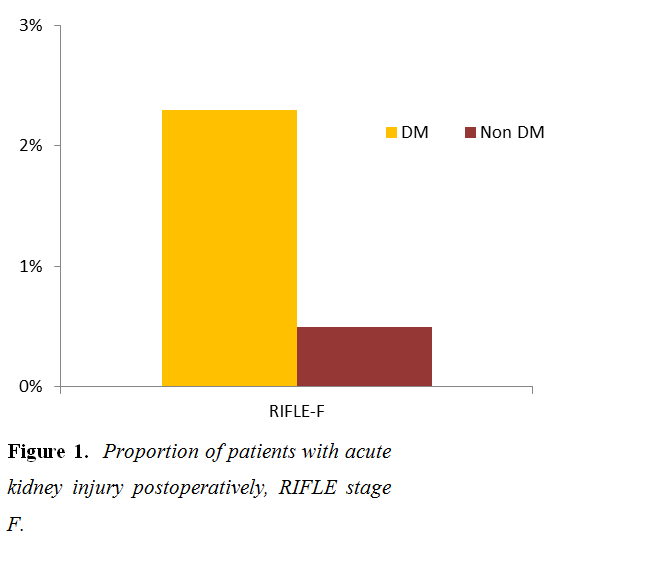
Figure 1. Proportion of patients with acute kidney injury postoperatively, RIFLE stage F.