
01. tbl. 100. árg. 2014
Inappropriate use of blood components in critical care?
Má bæta notkun blóðhluta á gjörgæsludeildum? Samanburður við klínískar leiðbeiningar
Introduction: Due to potential risk of blood transfusions, clinical guidelines emphasize restrictive use of blood components. However, numerous studies indicate that adherence to guidelines is often less than optimal. Furthermore, information regarding use of blood transfusion in intensive care units (ICUs) and compliance to clinical guidelines is lacking. We studied the use of blood components in two adult ICUs in Iceland and the compliance to clinical guidelines.
Materials and methods: All adult patients that received blood components in both ICUs at Landspitali during 6 months in 2010 were studied. Hematology and coagulation parameters as well as indications for administration were compared with hospital guidelines.
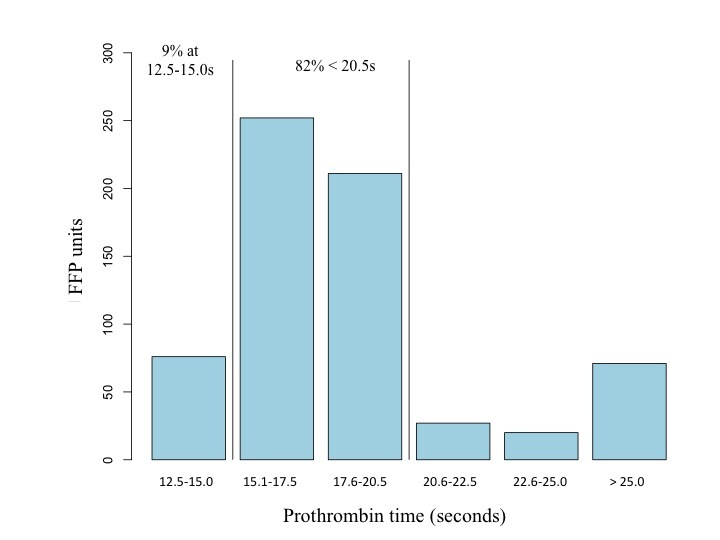
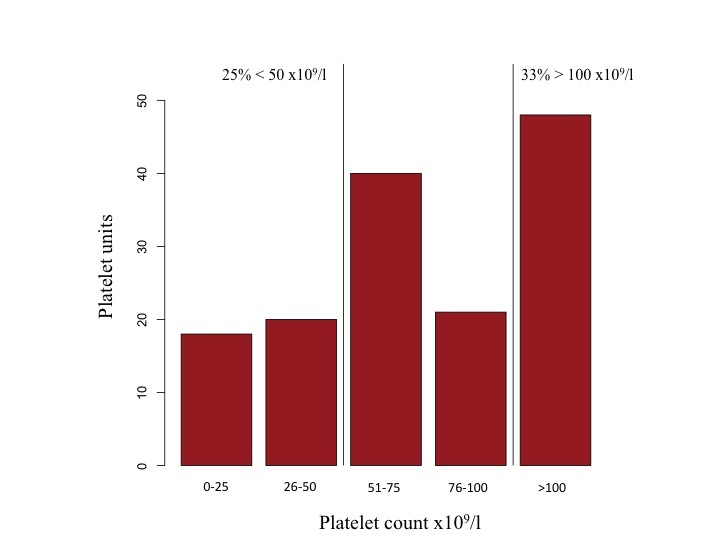
Results: 202 patients (34%) received blood components, half of them after surgery. 30% received red-blood cells (RBCs), 18% fresh frozen plasma (FFP) and 9% platelets. The mean hemoglobin value before RBC transfusion was 87 g/L, but in one third of cases it exceeded 90 g/L. FFP was transfused at a normal prothrombin time in 9% of cases. No coagulation parameters were available before transfusion of 5% of FFP. Mean platelet count before transfusion of platelets was 82 x109/L and in 34% of cases it exceeded 100 x109/L.
Conclusion: One third of patients received blood components during their ICU stay, most commonly RBCs. At least 6% of RBCs, 14% of FFPs and 33% of platelets were not transfused according to recent guidelines at Landspítali. Although our results are in line with findings of other studies it appears that the use of blood components in Icelandic ICUs can be improved.
Key words: Blood transfusion, intensive care unit, red blood cells, fresh frozen plasma, platelets, transfusion clinical guidelines.
Table I. Reasons for ICU admission and the amount of blood units transfused in each subgroup.
|
Study patients n=202 (%) |
RBCs n=8282 (%) |
FFP n=7472 (%) |
Platelets n=1472 (%) |
|
| Operative1 | 107 (53) | 416 (50) | 451 (60) | 74 (50) |
| Cardiac surgery | 55 (27) | 173 (21) | 234 (31) | 37 (25) |
| Gastrointestinal surgery | 24 (12) | 179 (22) | 166 (22) | 35 (24) |
| Vascular surgery | 10 (5) | 31 (4) | 26 (3) | 2 (1) |
| Other surgeries | 18 (9) | |||
| Non-operative1 | 99 (49) | 520 (63) | 395 (53) | 105 (71) |
| Shock/sepsis | 36 (18) | 307 (37) | 266 (36) | 71 (28) |
| Respiratory disease | 23 (11) | 91 (11) | 102 (14) | 28 (19) |
| Gastrointestinal disorder | 21 (10) | 270 (33) | 219 (29) | 57 (39) |
| Cardiovascular disease | 18 (9) | |||
| Other | 21 (10) |
1 Reasons for admission could be more than one per patient.
2 Total number of units transfused.
Table II. Blood product specific information for all patients admitted to the ICUs (n). Number of units and transfusion episodes. Pre-transfusion values are shown as means ± SD.
| n=598 (%) | Units | Transfusion episodes | Pre-transfusion laboratory values | |
| RBCs | 179 (30) | 828 | 365 |
Haemoglobin 87 ± 12 g/l |
| FFP | 107 (18) | 747 | 186 |
Prothrombin time 20,4 ± 11 seconds |
| Platelets | 51 (9) | 147 | 106 |
Platelet count 82 ± 49 x109/l |
Table III. Comparison of different subgroups in terms of pre-transfusion laboratory values that are shown as means (SD). Comparison is between all included in the subgroup and other study patients that were not within that group. 1
| In the subgroup | Not in the subgroup | p-value3 | |
| RBCs transfusion (n=179)2, haemoglobin g/l (SD) | |||
| Surgery (n=90) | 89 (9) | 84 (14) | 0.006* |
| Cardiac surgery (n=45) | 90 (8) | 86 (13) | 0.07 |
| Ischemic heart disease (n=87) | 88 (9) | 86 (14) | 0.07 |
| 70 years and older (n=95) | 88 (9) | 90 (13) | 0.07 |
| Haematologic disease (n=11) | 82 (15) | 90 (11) | <0.001* |
| Shock/Sepsis (n=31) | 90 (14) | 89 (10) | 0.049* |
| FFP transfusion (n=107)2, prothrombin time (SD) | |||
| Surgery (n=69) | 17.4 (5) | 26.7 (20) | 0.003* |
| Cardiac surgery (n=41) | 16.6 (2) | 22.4 (16) | 0.02* |
| Cirrhosis (n=6) | 20.7 (9) | 24.6 (14) | 0.07 |
| Platelet transfusion (n=51)2, platelet count x109/l (SD) | |||
| Cardiac surgery (n=21) | 125 (40) | 63 (40) | <0.001* |
| Haematologic disorder (n=9) | 41 (38) | 89 (45) | <0.001* |
1 For example surgical patients (n=90) had mean pre-transfusion haemoglobin value of 89 g/l compared with 84 g/l in patients that had no surgery (p=0.006).
2 Number of patients that were transfused with blood product.
3To account for repeated transfusions per patient a mixed linear regression analysis was used. A two sided p value of 0.05 was considered statistically significant.
Figure 1. Distribution of haemoglobin values preceding RBC transfusion. Vertical lines show percentage of RBC units given under haemoglobin value of 70 g/l or over 90 g/l.
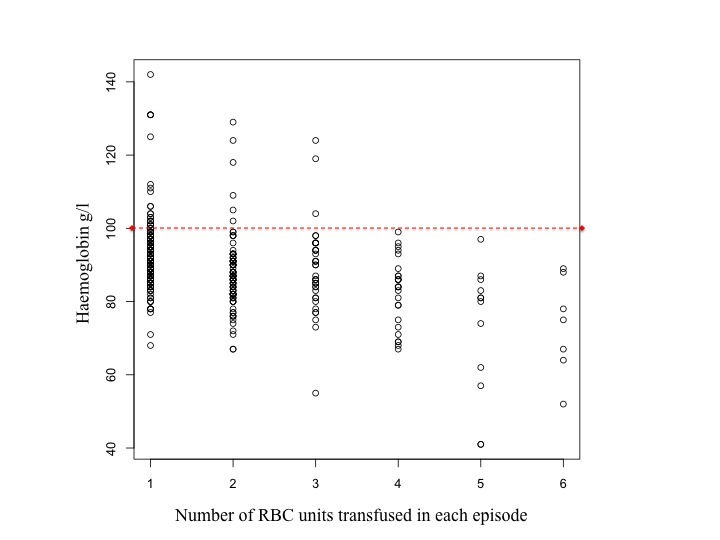
Figure 2. Pre-transfusion haemoglobin value plotted against the number of RBC units given in each transfusion episode. The red dotted line indicates transfusions at haemoglobin value exceeding 100 g/l.
Figure 3a. Number of RBC units (838 RBC units in total) transfused in each transfusion episode (365 transfusion episodes in total).
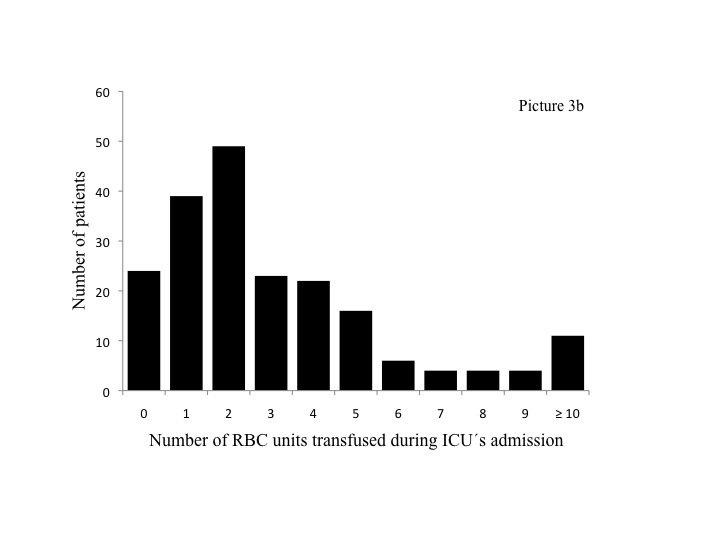
Figure 3b. The amount of RBC units transfused for all 202 study patients during their ICU admission.
Figure 4. Overview of all 439 transfusion episodes. Out of all 365 RBC transfusion episodes, FFP was also transfused in 89 episodes, thereof 50 times with platelets as well.
Figure 5. Distribution of prothrombin time preceding FFP transfusions. Vertical lines indicate the percentage of FFP units given below 20.5s, or prothrombin time normal range value, 12.5-15.0s.
Figure 6. Distribution of platelet count preceding platelet transfusions. Vertical lines show the percentage of platelet units given on a platelet count under 50x109/l or over 100x109/l.
Correspondence: Gísli H. Sigurðsson, gislih@landspitali.is
Oddason KE1,2,4, Gudbjartsson T2,4, Gudmundsson S3,4, Karason S1,4, Hreinsson K1, Sigurdsson GH1,4
1Departments of Anaesthesia & Intensive Care and 2Surgery, and 3Blood Bank, Landspítali University Hospital, 4Faculty of Medicine, University of Iceland