
05. tbl. 99. árg. 2013
Effect of coronary calcification on diagnostic accuracy of the 64 row computed tomography coronary angiography
Áhrif kalks í kransæðum á greiningargildi TS-kransæðarannsókna
Introduction: Coronary artery calcium is known to complicate the evaluation of stenoses using computer tomography (CT). The aim of this study was to analyze the effect of coronary calcification on the diagnostic accuracy of CT coronary angiography in an Icelandic population.
Material and methods:The study was a retrospective analysis of 417 consecutive subjects that underwent CT coronary angiography and subsequent conventional coronary angiography within 6 months. Subjects were divided based on total Agatston score: 0, 0.1-10, 10.1-100, 100.1-400, 400.1-750 and >750. Sensitivity, specificity, positive and negative predictive values were calculated for ≥50% stenoses diagnosed with the CT, using the conventional coronary angiography as a reference. Correlation between Agatston score and ≥50% stenoses was calculated.
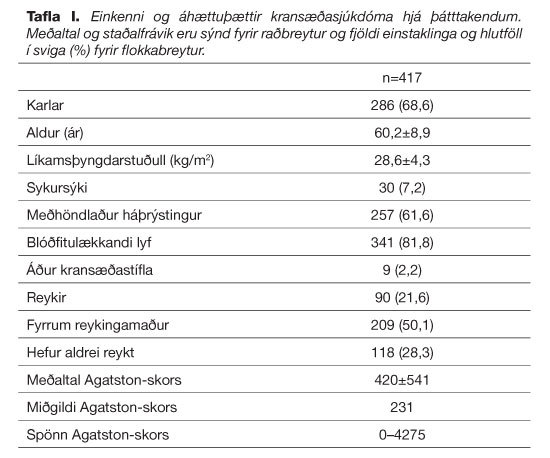
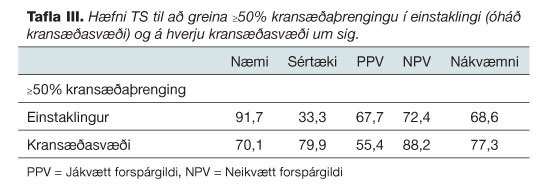
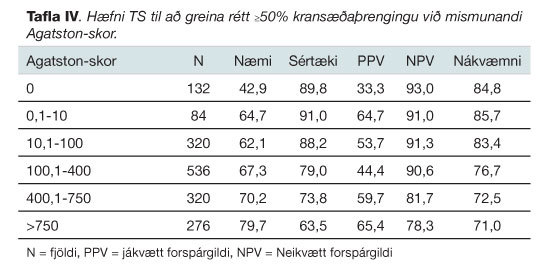
Results: A total of 1668 coronary artery segments in 417 individuals were evaluated (68.6% men, mean age 60.2 ± 8.9). The total mean Agatston score was 420 (range from 0-4275). CT detected >50% stenoses with a sensitivity of 70.1%, specificity of 79.9% and positive and negative predictive values of 55.4% and 88.2%, respectively. The negative predictive value was 93.0% for Agatston score zero but 78.3% for Agatston score ˃750. An Agatston score threshold of 363 predicted ≥50% coronary stenoses with 49.6% sensitivity.
Conclusion: Diagnostic accuracy is moderate with good negtive predictive value and specificity. Although coronary calcification reduces diagnostic accuracy, negative predictive value is only mildly affected for Agatston score as high as 400. Agatston score is not a good predictor of ≥50% coronary artery stenoses. No particular Agatston score cut-off level was identified to indicate whether CT angiography was useless or not.
Table I. Characteristics and risk factors for coronary heart disease in subjects. Average and standard deviation are shown for numerical data and numbers and ratios (%) are shown for categorical data.
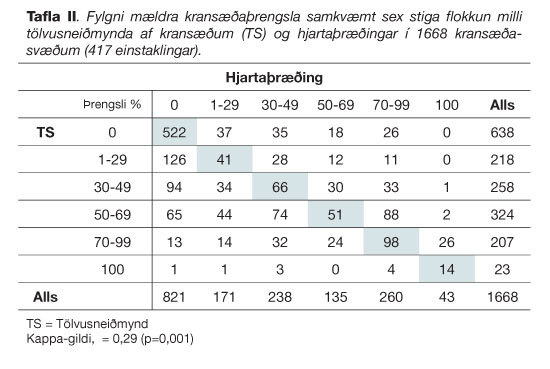
Table II. Comparison of coronary stenoses (stenoses classified in six stages) in 1668 coronary artery segments (417 subjects) with computed tomography (CT) coronary angiography and conventional angiography.
Table III. Diagnostic accuracy of CT coronary angiography for detection of ≥50% coronary stenoses per subject and per coronary artery segments.
Table IV. Diagnostic accuracy of CT coronary angiography for detection of ≥50% coronary stenoses in different Agatston score level groups.
Figure 1. Agatston score (median) for men and women in four different age catagories with number of individuals in each category.
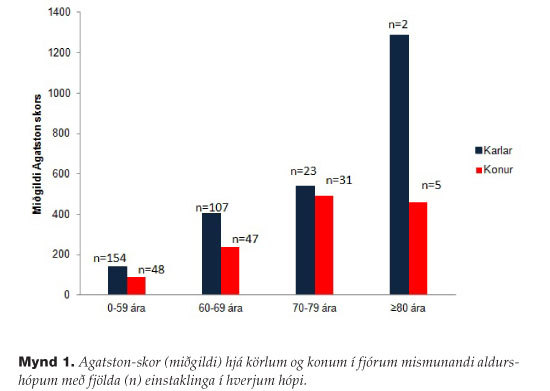
Figure 2. Histogram that shows coronary stenoses ratios between CT coronary angiography and conventional angiography for different Agatston score levels.
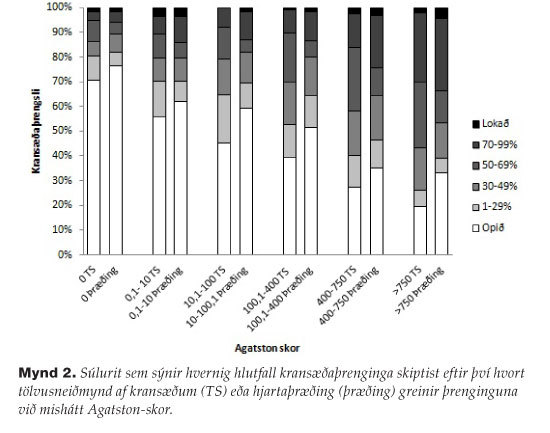
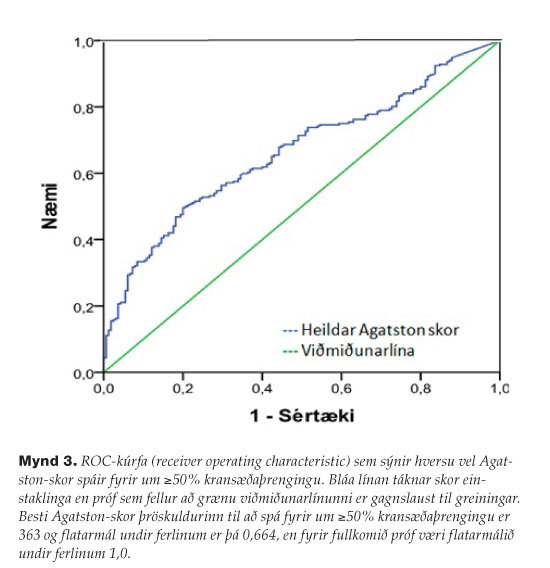
Figure 3. Receiving operating characteristic (ROC) curve for all subjects, describing the diagnostic performance of coronary artery calcium score to identify a ≥50% coronary stenoses in subjects compared to conventional coronary angiography. The blue line corresponds to Agatston score for subjects and the green line is reference line for useful diagnostic test. Area under the curve is 0.664 but perfect test would have an area under the curve 1.0. An Agatston score threshold of 363 is best to identify a ≥50% coronary stenoses.
1Department of radiology, The National University Hospital of Iceland, 2Faculty of Medicine, University of Iceland, 3Department of cardiology, The National University Hospital of Iceland, 4Röntgen Domus, Domus Medica.