
05. tbl. 101. árg. 2015
Fræðigrein
Physical activity and physical condition of Icelandic primary and secondary school children with intellectual disability
Hreyfing og líkamlegt ástand íslenskra grunnskólabarna með þroskahömlun
Introduction: Little is known about physical activity, body composition and metabolic risk factors among children with intellectual disability (ID). The purpose of this study was to investigate their physical condition.
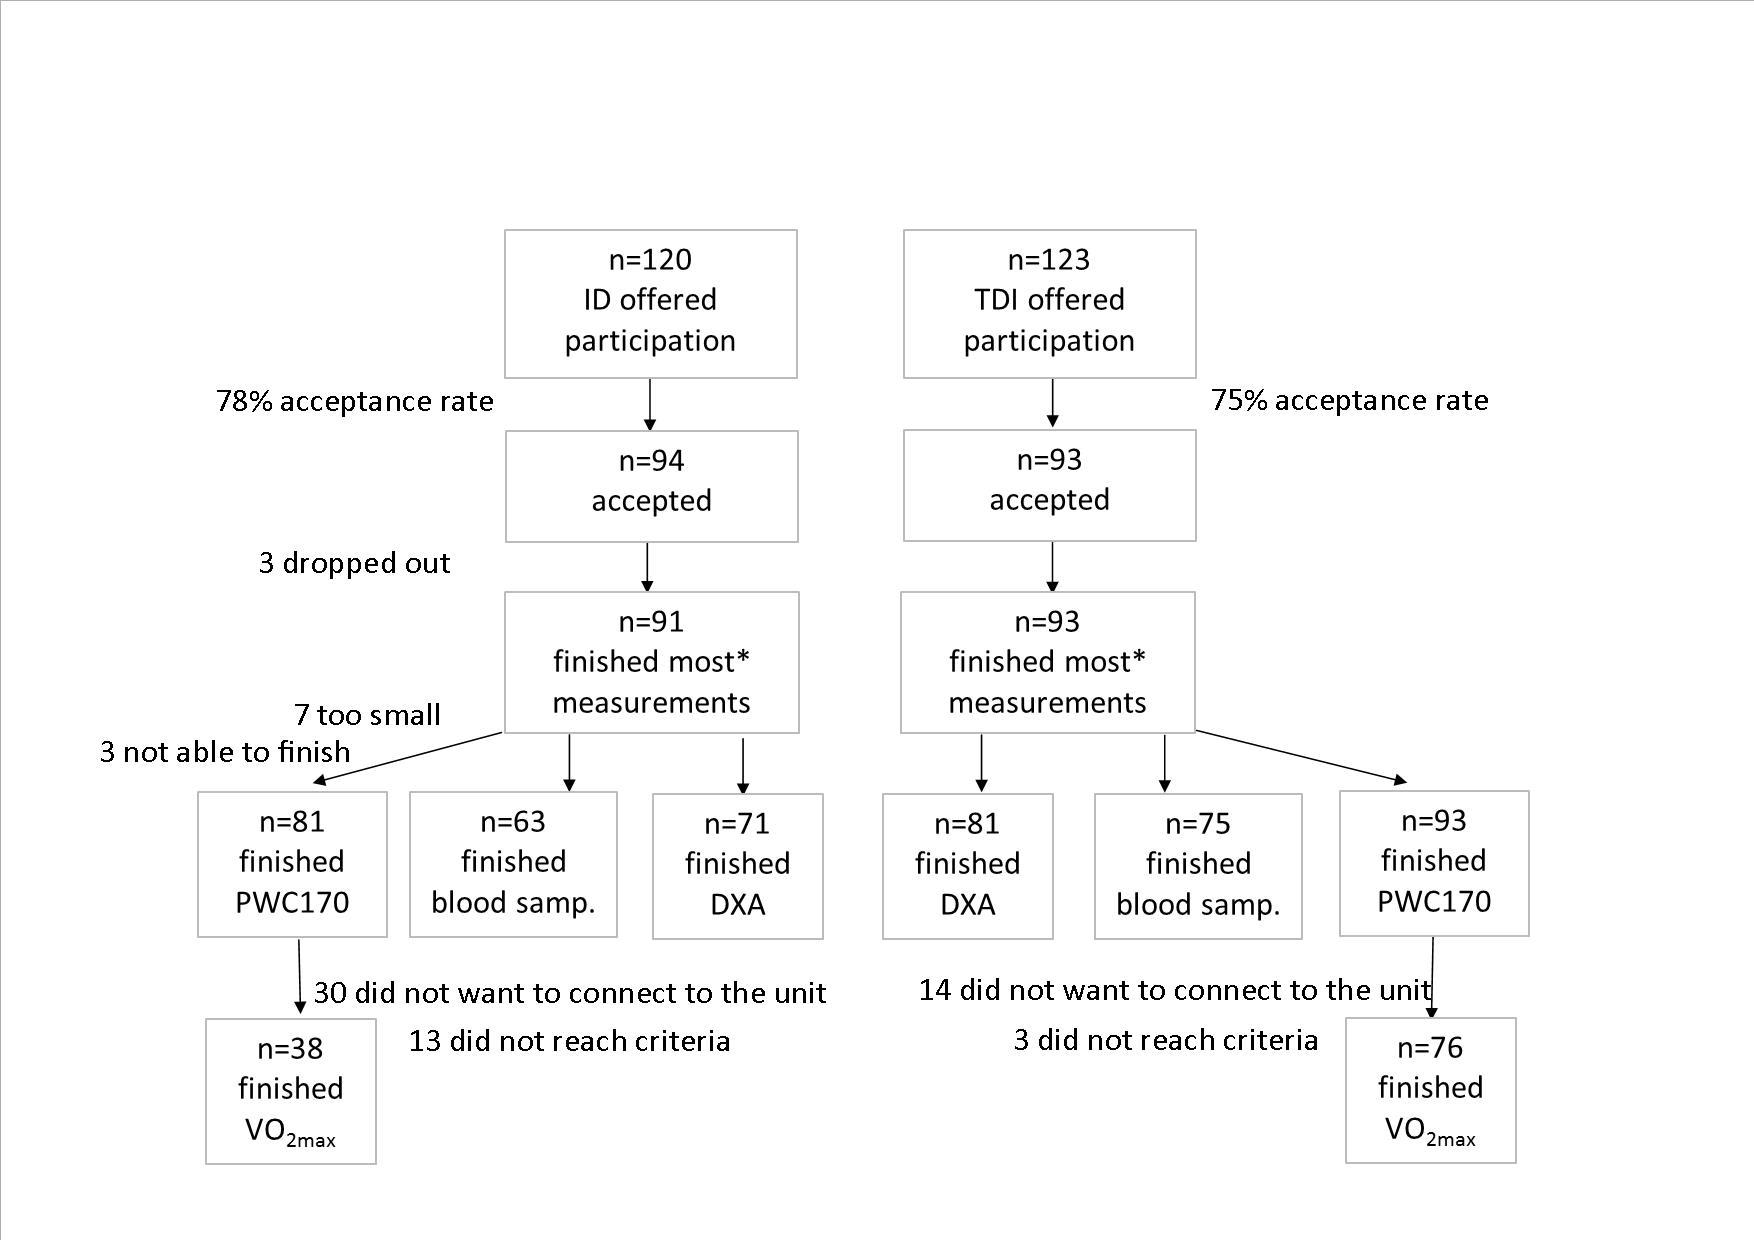
Material and methods: Children with ID (n=91) and a randomly selected age-and-gender matched group of 93 typically developed individuals (TDI) participated and the groups were compared on physical activity, fitness, body composition, blood pressure, blood lipids, and glycemic control.
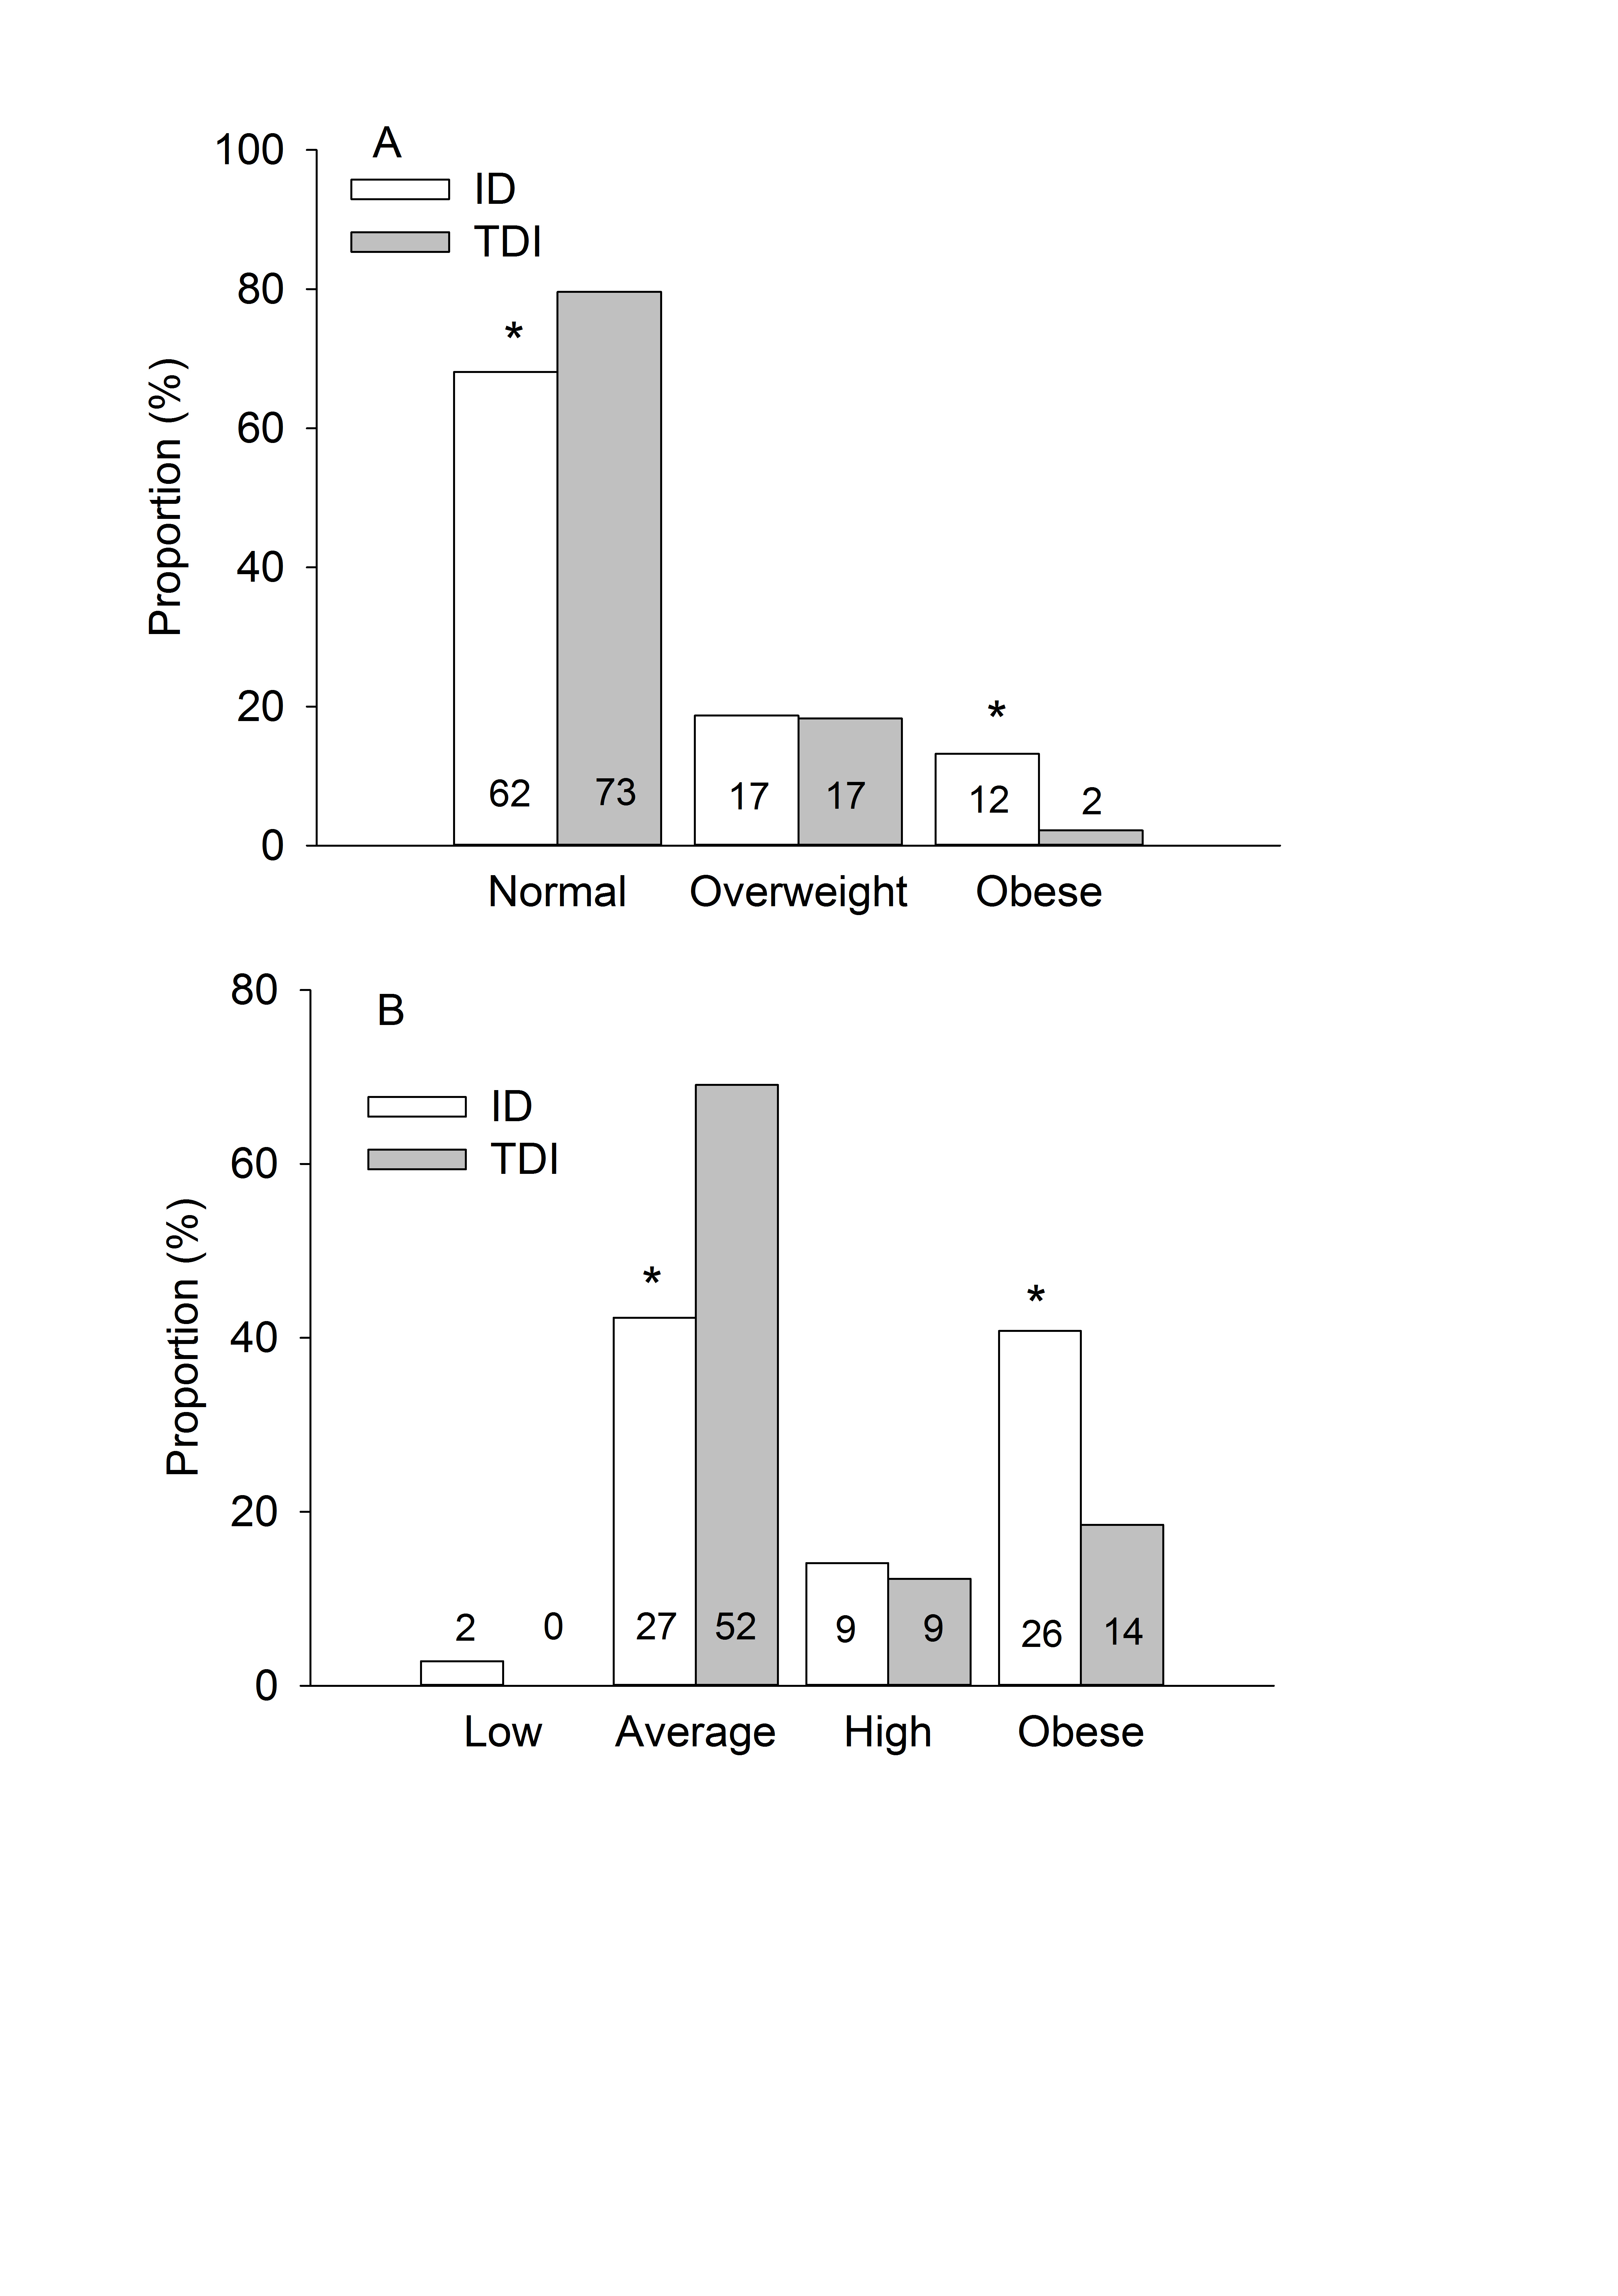
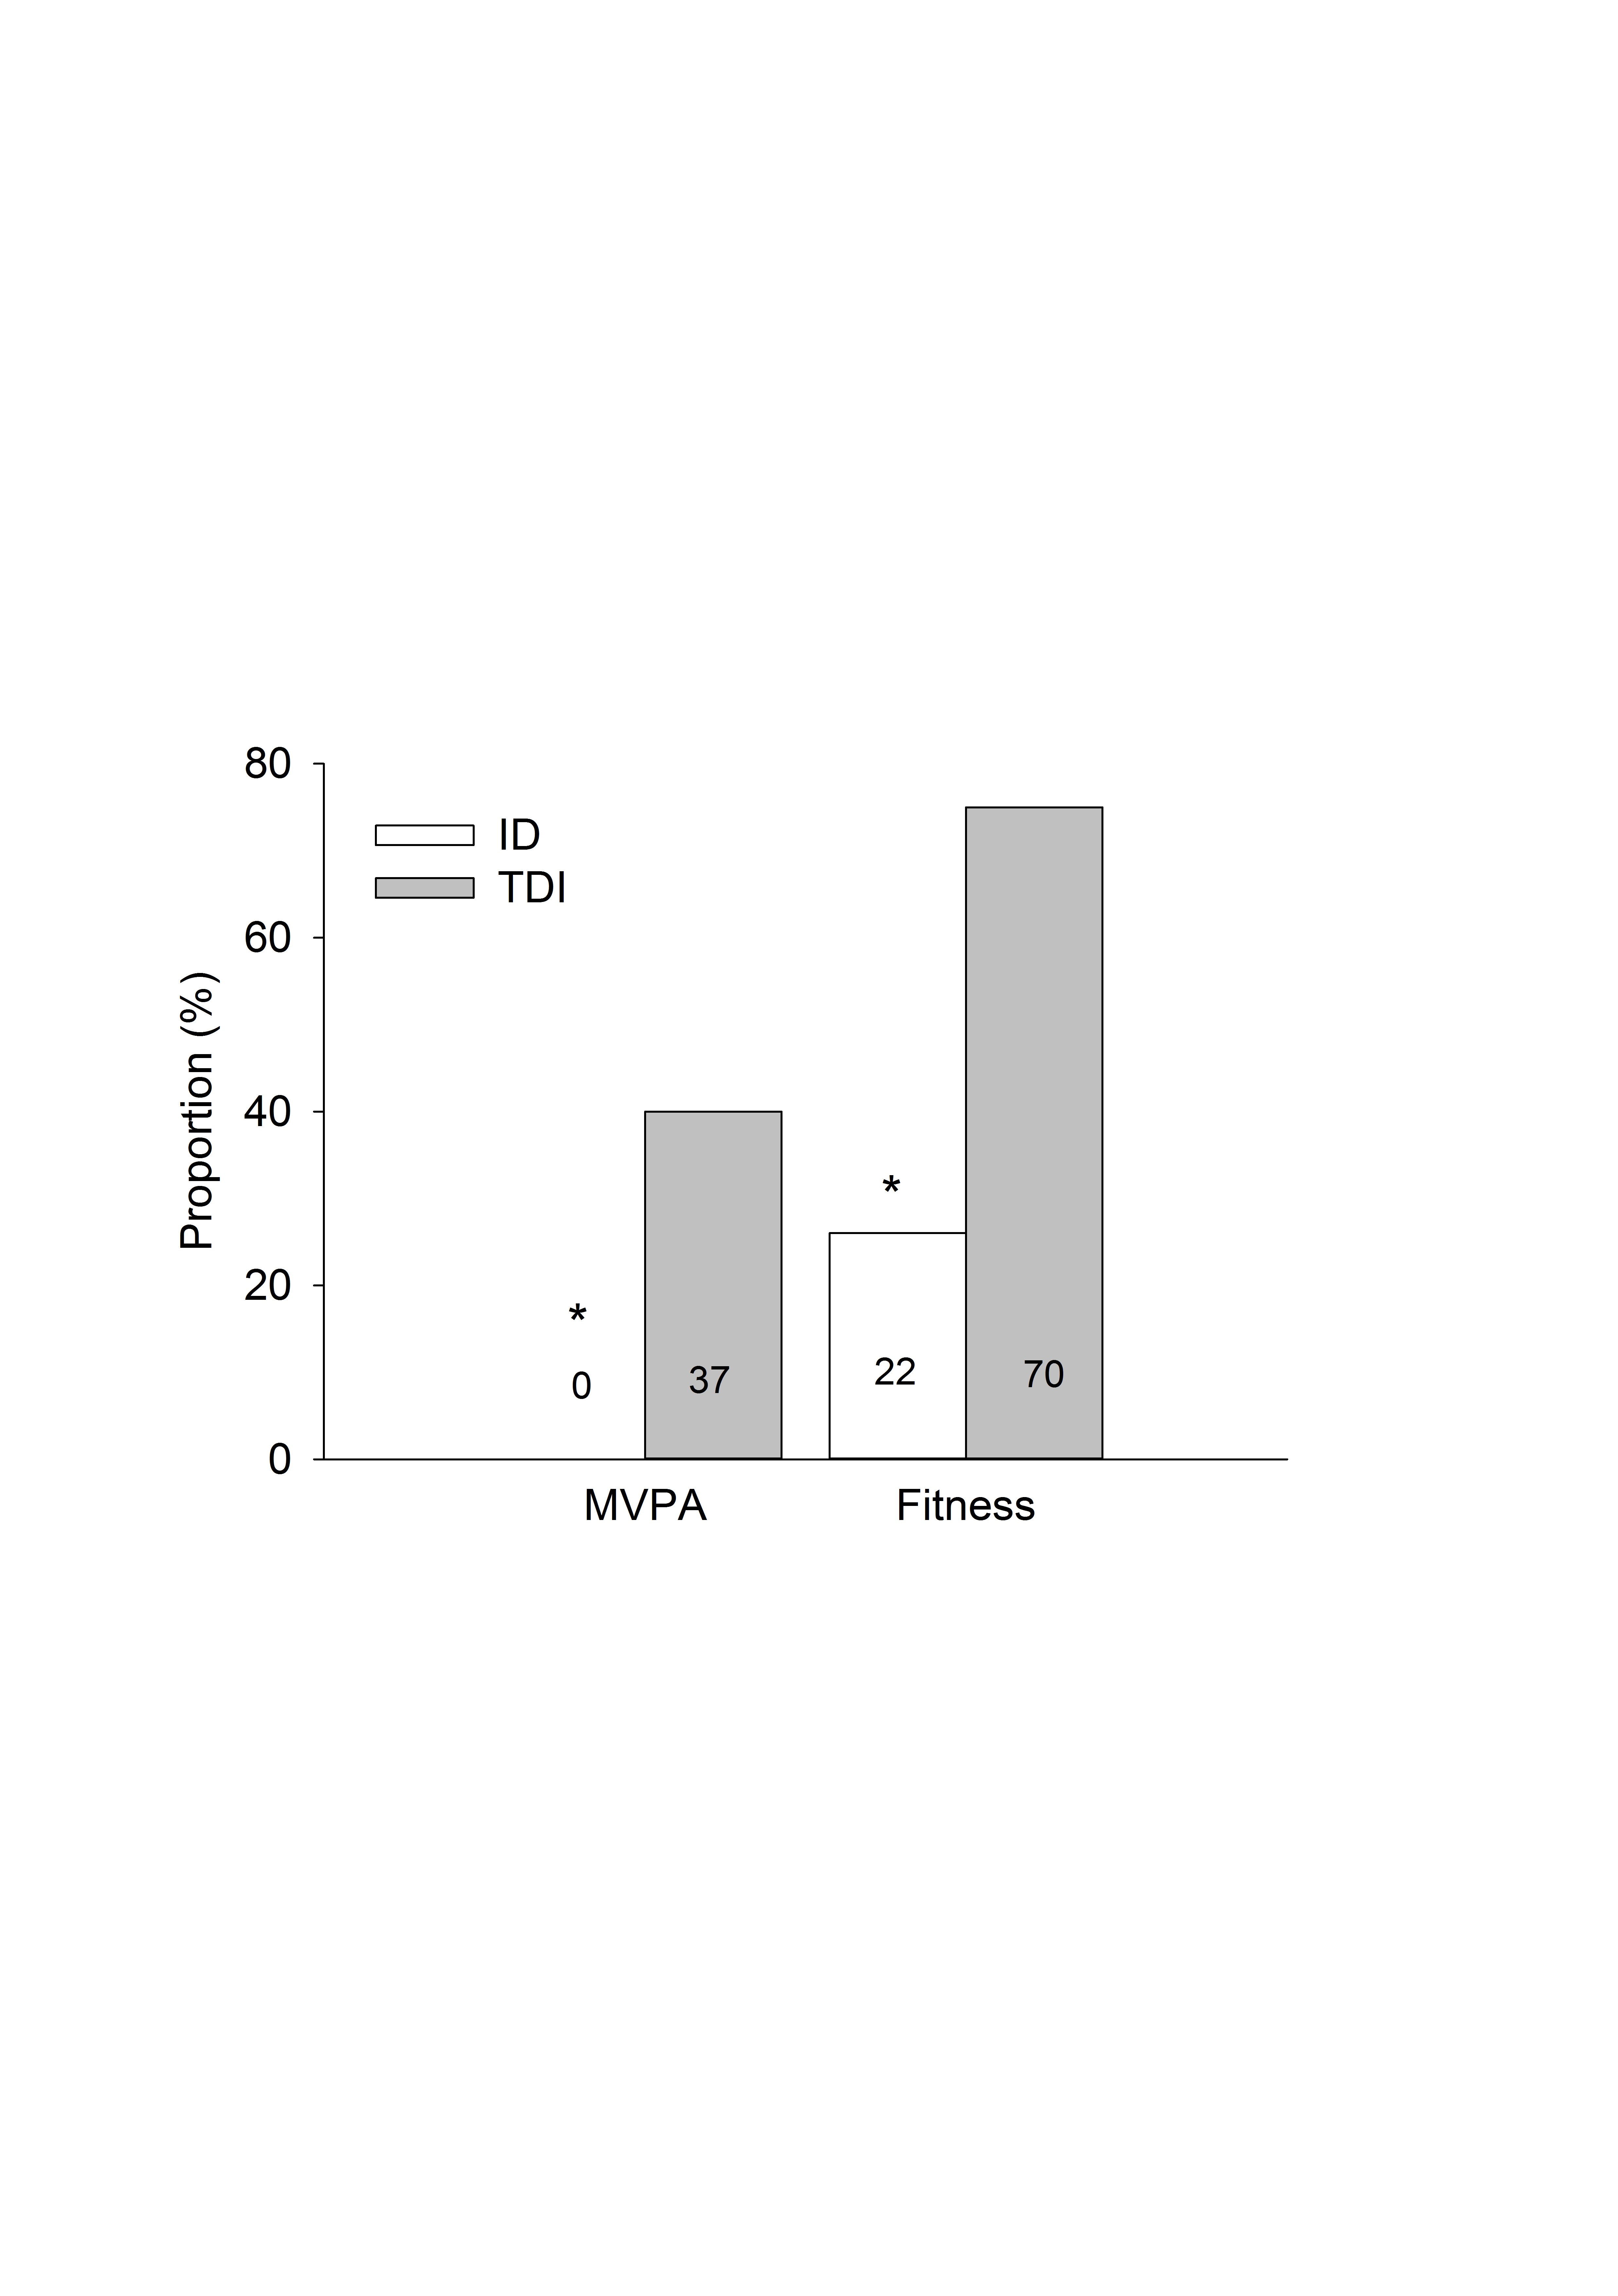
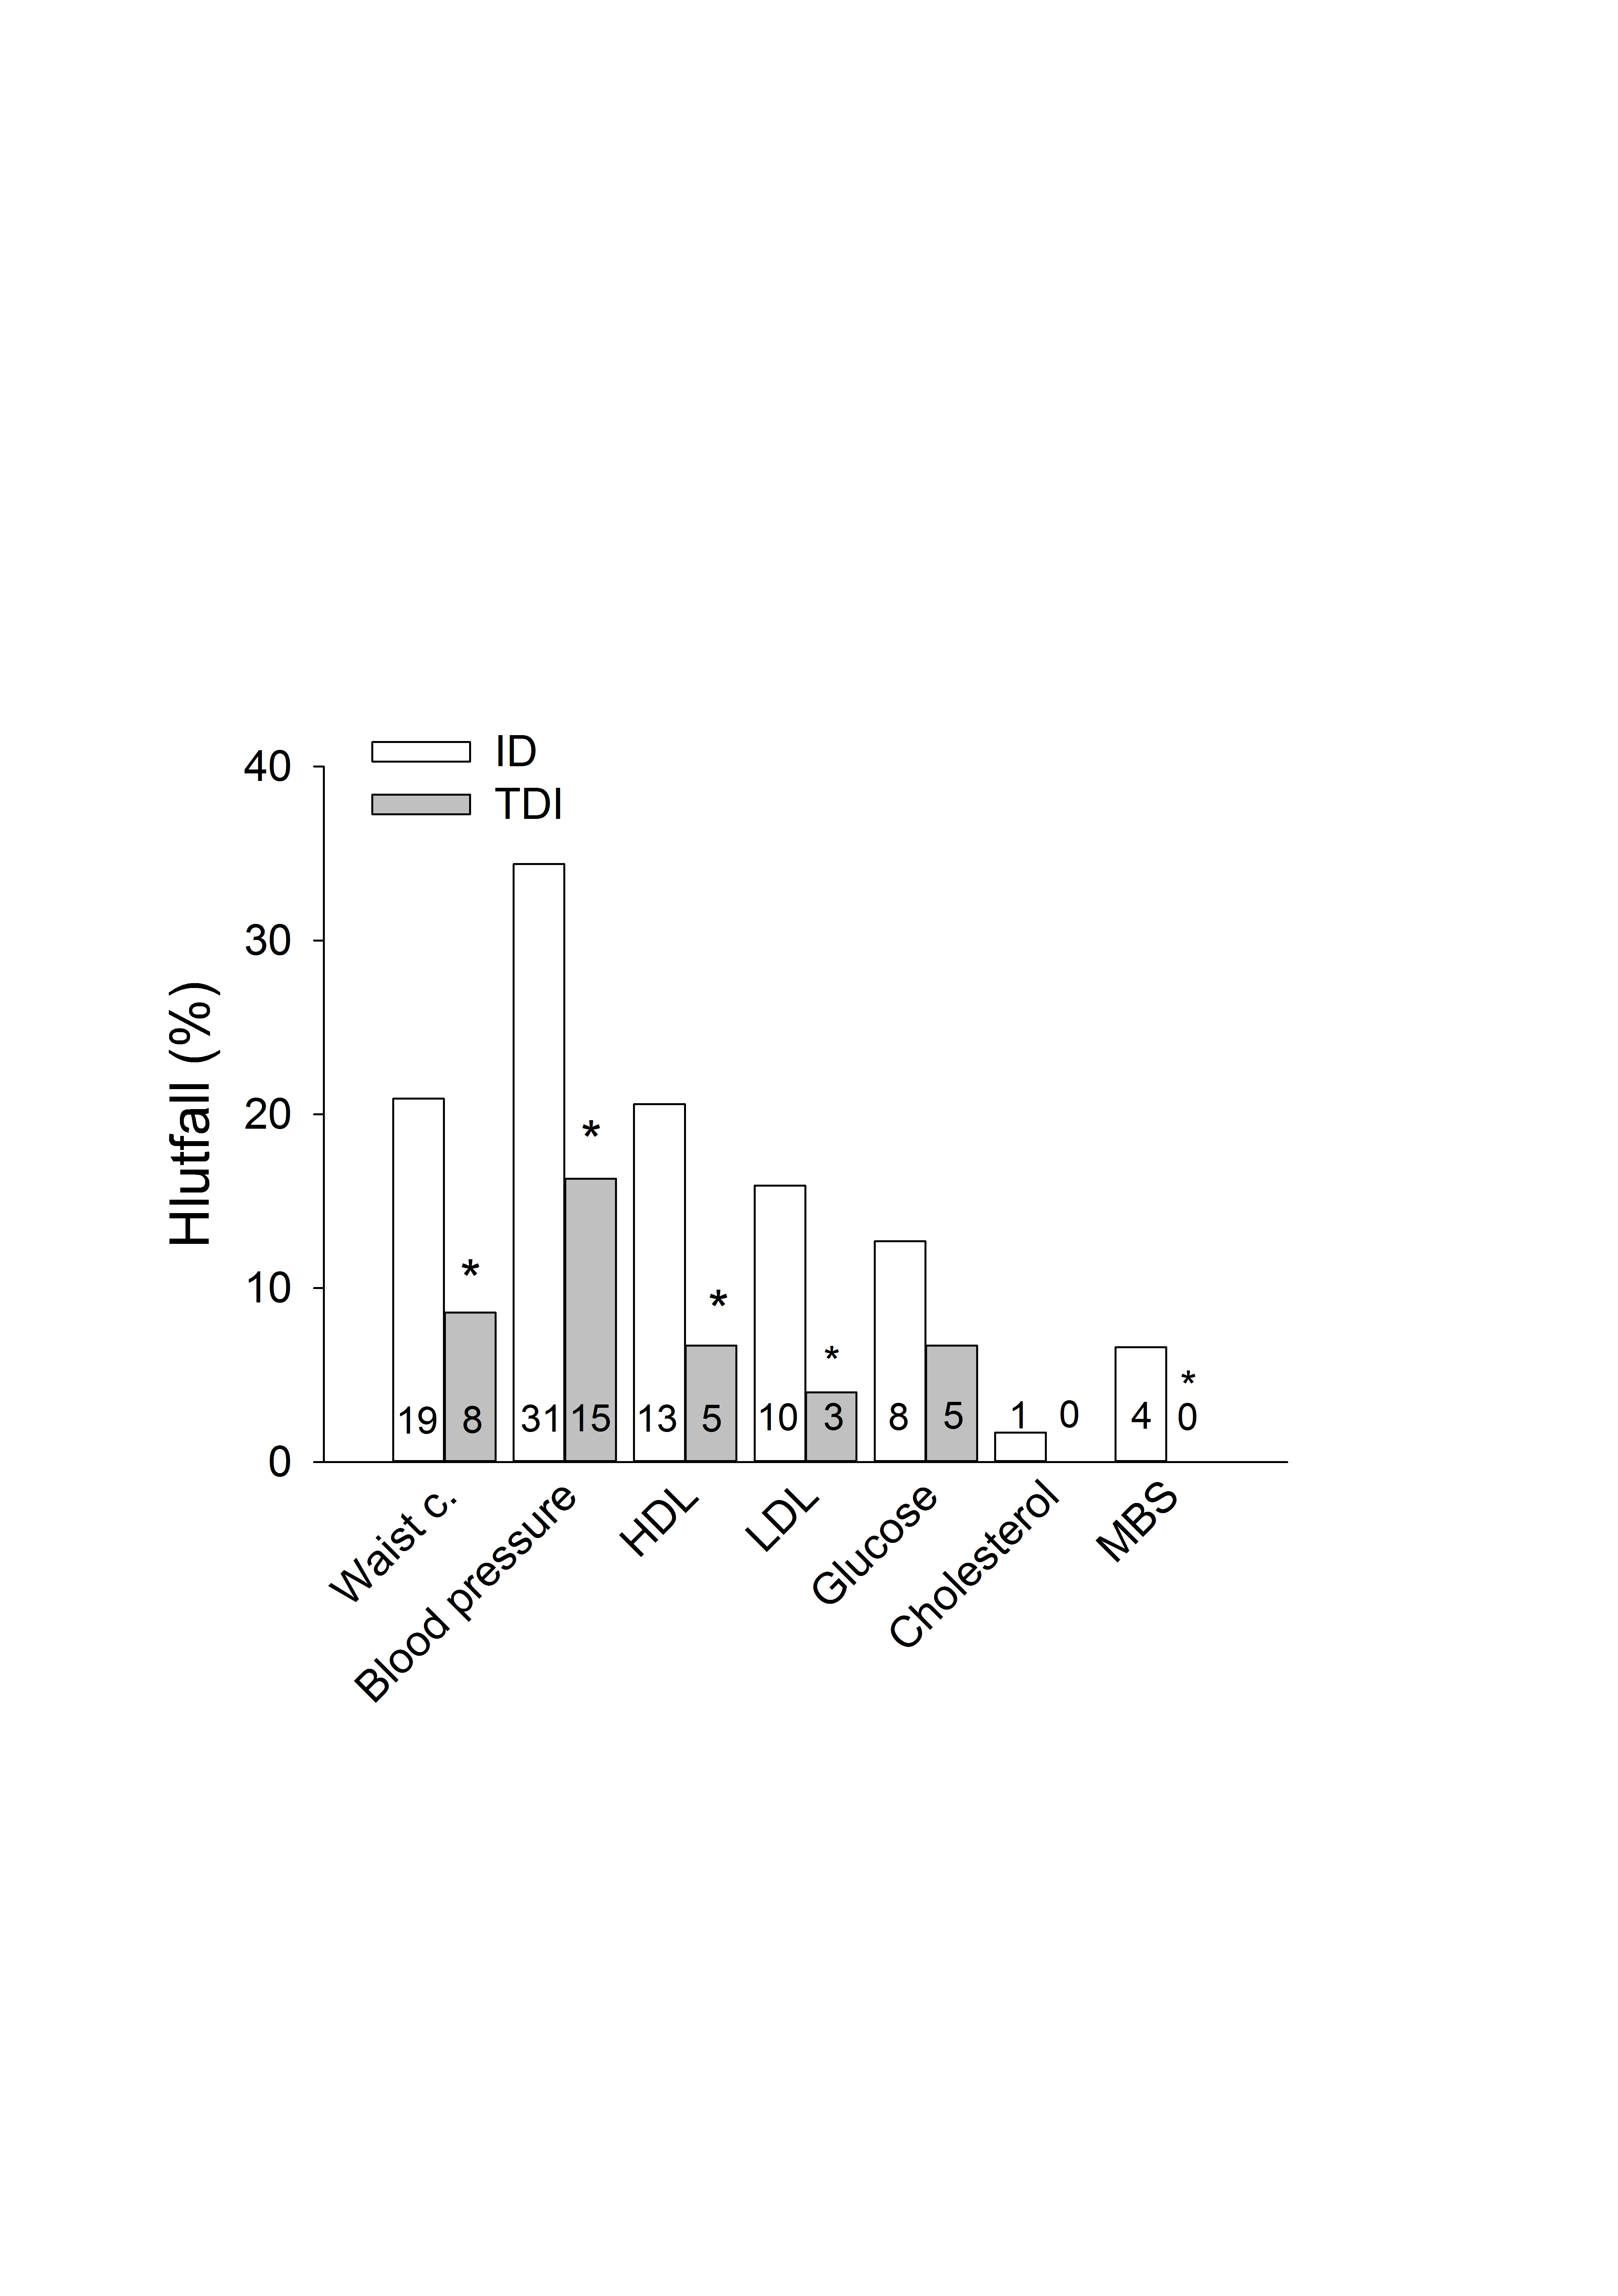
Results: Children with ID were shorter (-8.6 cm, p<0.001), had greater skinfolds (p<0.001), diastolic blood pressure (22.7 mm, p=0,006), and body fat percentage (4.0 percentage points, p=0.008) than TDI children. Boys with ID had larger waist circumference than TDI boys (6.3 cm, p=0.009) but no difference was found among the girls. Higher proportion (41%) of children with ID than TDI children (19%) were categorized as obese (p=0.006) based on body fat percentage. No children with ID reached the recommended daily 60 minutes of moderate- to vigorous physical activity compared to 40% of the TDI children. Only 25% of children with ID achieved the recommended levels for fitness, whereas the same proportion was 75% among TDI children. Over 20% of the children with ID had elevated waist circumference, 34% elevated blood pressure, 13-21% elevated metabolic risk factors in the blood, and 7% were diagnosed with metabolic syndrome. These prevalences were lower among the TDI children.
Conclusion: Physical condition of children with ID is poor and inferior to their TDI peers. Further studies are needed to investigate the reasons underlying the poor physical health among children with ID and how it can most effectively be enhanced.
Figure captions
Figure 1: Participation and dropout. ID = children with intellectual disability, TDI = typically developed individuals, DXA = dual energy X-ray absorptiometry, PWC170 = physical work capacity at heart rate 170 beats/min, VO2max = maximal oxygen uptake, samp. = sampling. * = anthropometry, physical activity, and blood pressure,
Figure 2: The proportion of participants classified as overweight based on body mass index (A) and body fat percentage (B). The values in the bars indicate the number of participants. ID = children with intellectual disability, TDI = typically developed individuals, * = Statistical difference between groups p < 0.05.
Figure 3: The proportion of participants reaching the recommendations for moderate-to-vigorous physical activity and recommended level of aerobic fitness. The values in the bars indicate the number of participants. ID = children with intellectual disability, TDI = typically developed individuals, MVPA = moderate-to-vigorous physical activity, * = Statistical difference between groups p < 0.05.
Figure 4: The proportion of participants outside recommended levels for various cardiovascular and metabolic risk factors. The values in the bars indicate the number of participants. ID = children with intellectual disability, TDI = typically developed individuals, Waist c. = waist circumference, HDL = high-density lipoproteins, LDL = low-density lipoproteins, MBS = metabolic syndrome, * = Statistical difference between groups p < 0.05.
Tables
Table I: Physical characteristics of the participants
|
ID boys n=62 |
TDI boys n=58 |
ID girls n=29 |
TDI girls n=35 |
All ID n=91 |
All TDI n=93 |
|
| Age (year) | 11.8 (2.8) | 11.9 (2.9) | 11.9 (2.6) | 12.0 (2.3) | 11.9 (2.9) | 11.9 (2.7) |
| Weight (kg) | 47.7(21.0) | 47.1 (16.5) | 43.1 (14.3) | 49.9 (12.0) | 46.2 (19.2) | 48.2 (15.0) |
| Height (cm) | 149.1 (18.4) | 155.7 (20.7) | 144.1 (14.6) | 156.7 (13.9) | 147.5 (17.4) | 156.1 (18.3)* |
| BMI (kg/m2) | 20.6 (5.6) | 18.7(2.8) | 20.3 (4.3) | 20.1 (2.9) | 20.5 (5.2) | 19.2 (2.9) |
| Σskin. (mm) | 75.6 (45.1) | 45.9 (29.7) | 83.7 (31.5) | 71.2 (25.7) | 78.2 (41.3) | 55.5 (30.7)*† |
| Waist c. (cm) | 71.1 (16.1) | 64.8 (8.3)a | 66.1 (9.9) | 67.3 (8.3) | 69.5 (14.6) | 65.7 (8.4)*‡ |
| SBP. (mmHG) | 116.0 (9.5) | 112.2 (7.8) | 114.5 (7.0) | 115.1 (5.3) | 115.5 (8.8) | 113.3 (7.1) |
| DBP. (mmHG) | 75.7 (7.6) | 71.6 (8.2) | 71.8 (6.8) | 69.3 (7.2) | 74.5 (7.6) | 70.7 (7.9)*† |
| n=48 | n=49 | n=23 | n=32 | n=71 | n=81 | |
| Body fat (%) | 28.5 (10.4) | 22.7 (5.8) | 31.5 (8.1) | 29.7 (5.8) | 29.5 (9.8) | 25.5 (7.5)*† |
ID = children with intellectual disabillity, TDI = typically developed individuals, BMI = body mass index, Σskin. = sum of skinfold, Waist c. = waist circumference, SBP = systolic blood pressure, DBP = diastolic blood pressure, * = Statistical difference between groups p < 0.05, † = statistical difference between sexes p < 0.05, ‡ = interaction between group and sex p < 0,05, a = difference between boys with intellectual disability and typically developed boys p < 0.05.
Table II: Physical activity and fitness of participants
|
ID boys n=62 |
TDI boys n=58 |
ID girls n=29 |
TDI girls n=35 |
All ID n=91 |
All TDI n=93 |
|
|
MVPA (mín) |
24.3 (15.9) | 65.9 (28.6)a | 24.7 (12.8) | 44.9 (22.9)b | 24.4 (14.9) | 57.9 (28.4)*‡† |
| n=26 | n=45 | n=12 | n=31 | n=38 | n=76 | |
|
VO2max (ml/mín/kg) |
36.3 (6.2) | 44.82 (5.85) | 35.39 (3.74) | 39.55 (4.01) | 36.02 (5.34) | 42.67 (5.77)*† |
| n=55 | n=58 | n=26 | n=35 | n=81 | n=93 | |
|
PWC170 (w/kg) |
1.46 (0.43) | 1.93 (0.37) | 1.38 (0.40) | 1.66 (0.32) | 1.43 (0.42) | 1.83 (0.38)*† |
|
Est.19 VO2max (ml/mín/kg)
|
35.28 (6.2) | 42.06 (5.35) | 34.07 (5.77) | 38.13 (4.60) | 34.89 (6.03) | 40.58 (5.41)*† |
ID = children with intellectual disability, TDI = typically developed individuals, MVPA = moderate- to vigorous physical activity, Est. = estimated, * = statistical difference between groups p < 0.05, † = statistical difference between sexes p < 0.05, ‡ = interaction between group and sex p < 0.05, a = difference between boys with intellectual disability and typically developed boys p < 0.05, b = difference between girls with intellectual disability and typically developed girls p < 0.05.
Table III: Blood lipids and glycemic control of the participants
|
ID boys n=43 |
TDI boys n=45 |
ID girls n=20 |
TDI girls n=30 |
All ID n=63 |
All TDI n=75 |
|
|
Total Cholesterol (mmol/L) |
4.24 (0.81) | 4.21 (0.63) | 4.38 (1.09) | 4.31 (0.20) | 4.29 (0.90) | 4.25 (0.63) |
|
HDL (mmol/L) |
1.49 (0.42) | 1.66 (0.32) | 1.56 (0.34) | 1.56 (0.29) | 1.51 (0.39) | 1.62 (0.31) |
|
LDL (mmol/L) |
2.47 (0.81) | 2.30 (0.56) | 2.53 (1.01) | 2.41 (0.64) | 2.49 (0.87) | 2.35 (0.59) |
|
Triglycerides (mmol/L) |
0.64 (0.23) | 0.56 (0.22) | 0.67 (0.31) | 0.74 (0.20) | 0.65 (0.26) | 0.63 (0.23) |
|
Glucose (mmol/L) |
5.10 (0.46) | 5.07 (0.39) | 5.12 (0.48) | 4.95 (0.33) | 5.10 (0.47) | 5.02 (0.37) |
|
Insulin (цU/mL) |
9.57 (5.95) | 7.13 (3.99)a | 9.07 (4.44) | 10.29 (5.15) | 9.42 (5.49) | 8.39 (4.72)‡ |
ID = children with intellectual disability, TDI = typically developed individuals, HDL = high-density lipoproteins, LDL = low-density lipoproteins, ‡ = interaction between group and sex p < 0.05, a = difference between boys with intellectual disability and typically developed boys p < 0.05.