01. tbl. 97. árg. 2011
Prevalence of food allergy in Icelandic infants during first year of life
Prevalence of food allergy in Icelandic infants during first year of life
Objective: This study is a part of EuroPrevall, an EU-funded European food allergy project. The aim was to evaluate the prevalence of food allergy in Icelandic infants during their first year of life.
Material and methods: Infants (n=1,341) were followed prospectively from birth to 12 months of age. Questionnaires were obtained at birth and 12 months. Children with symptoms of possible food allergy were assessed with a skin-prick test (SPT) and specific IgE. Food allergy was confirmed with a double-blind placebo-controlled food challenge (DBPCFC).Results: Out of 170 symptomatic children 44 infants (3.27%) had either positive SPT (n=21; 1.57%) or specific IgE (n=40; 2.98%). Food allergy was confirmed in 25 (1.86%); egg allergy 1.42%, milk 0.52%, fish 0.22%, wheat 0.15%, peanuts 0.15%, and soy 0.07%. Atopic dermatitis was diagnosed in 7.90% (n=106) and according to questionnaires 8.80% had asthma (n=118). Positive family history was the strongest risk factor for asthma (OR=2.12; p<0.001) and atopic dermatitis (OR=1.90; p=0.004). Family history influenced the relationship between predisposing factors and allergy symptoms.
Conclusion: Our results show lower prevalence of food allergy than previously reported in a study of Icelandic children at two years of age. The prevalence was also lower than reported in some other European countries and could be explained by different genetic and environmental factors.
Tables and figures
Table I. Reasons for assessment by study doctor in the first year of life
| Reasons for assessmentI | Number of children | |
| n | % (n/1341)II | |
| Atopic dermatitis | 124 | 9.25% |
| Self-reported food allergy | 74 | 5.52% |
| Gastrointestinal symptoms | 43 | 3.21% |
| Urticaria | 23 | 1.72% |
| Respiratory symptoms | 7 | 0.52% |
| Control children | 61 | 4.55% |
I. Each child could have more than one reason for assessment
II. Percentage based on a total number of participants.
Table II. Number and percentage of children with food allergy according to method of diagnosis and allergen
| Allergen | Parent-perceived food allergy | Positive skin prick test | Positive IgE in serum | Provisionally food allergicI | Challenge-diagnosed food allergyII | Perceived vs. DiagnosedIII |
| Hen's egg | 7 (0.52%)IV | 17 (1.27%) | 29 (2.16%) | 32 (2.38%) | 19 (1.42%) | 4/4 |
| Cow's milk | 56 (4.18%) | 10 (0.75%) | 23 (1.72%) | 24 (1.79%) | 7 (0.52%) | 23/7 |
| Peanut | 3 (0.22%) | 9 (0.67%) | 9 (0.67%) | 2 (0.15%) | ||
| Fish | 5 (0.37%) | 1 (0.07%) | 2 (0.15%) | 2 (0.15%) | 3 (0.22%) | 0/0V |
| Wheat | 7 (0.52%) | 0 | 8 (0.16%) | 8 (0.60%) | 2 (0.15%) | 0/0V |
| Soya | 2 (0.15%) | 0 | 4 (0.30%) | 4 (0.30%) | 1 (0.07%) | 1/0 |
| Shrimp | 1 (0.07%) | |||||
| Cranberry | 1 (0.07%) | |||||
| Potato | 2 (0.15%) | |||||
| Pineapple | 1 (0.07%) | |||||
| Almond | 1 (0.07%) | 1 (0.07%) | 1 (0.07%) | |||
| Nutramigen | 1 (0.07%) | |||||
| Green peas | 1 (0.07%)VI | 1 (0.07%) |
I. Parent- or physician-perceived food allergy and sensitization (either positive skin prick test and/or positive IgE in serum).
II. Positive double blind placebo controlled food challenge. Total of 50 children (3.73%) were challenged; out of whom 11 had negative SPT and negative specific IgE but clinical suspicion of food allergy.
III. Children with parental perceived food allergy which underwent double blind-placebo controlled food challenge / challenge diagnosed food allergy.
IV. Number of children (n) and prevalence (n/1341).
V. None of the children with parent perceived food allergy were eligible for double blind-placebo controlled food challenge.
VI. One child had been skinprick-tested positive for green peas by another allergist and therefore green pea specific IgE was measured in serum.
Table III. Possible risk factors
| Possible risk factorI | Number of children | Challenge diagnosed food allergyII | ||
| N | % (N/1341) | n |
% (n/25) |
|
| The birth was elective caesarean or acute caesarean | 170 | 12.68% | 5 | 20% |
| The child received antibiotics during the first week | 85 | 6.33% | 2 | 8% |
| The child received oxygen in the hospital | 129 | 9.62% | 3 | 12% |
| The mother received antibiotic treatment during the birth | 135 | 10.07% | 4 | 16% |
| The mother received antibiotic treatment after the birth | 80 | 5.97% | 1 | 4% |
| The mother received antibiotic treatment during the pregnancy | 312 | 23.27% | 5 | 20% |
| The child had another drink than breast milk in the hospital | 413 | 30.80% | 8 | 32% |
| Mother with positive allergy history | 656 | 48.91% | 12 | 48% |
| Father with positive allergy history | 521 | 38.85% | 14 | 56% |
| Both parents with positive allergy history | 255 | 19.02% | 7 | 28% |
| The mother had preeclampsia | 75 | 5.59% | 1 | 4% |
| The mother had high blood pressure during the pregnancy | 141 | 10.52% | 3 | 12% |
| The mother had diabetes during the pregnancy | 34 | 2.54% | 1 | 4% |
| The mother had an urinary infection during the pregnancy | 138 | 10.29% | 0 | 0% |
| The mother had influenza or fever during the pregnancy | 420 | 31.32% | 0 | 0% |
| Both parents have a university degree | 424 | 31.62% | 11 | 44% |
| The mother smoked during the pregnancy | 103 | 7.68% | 0 | 0% |
| The mother suffered from indirect smoking during the pregnancy | 84 | 6.26% | 1 | 4% |
| The child suffered from indirect smoking | 437 | 32.59% | 8 | 32% |
| Pets at home | 376 | 28.04% | 9 | 36% |
| The mother took cod liver oil regularly during the pregnancy | 495 | 37.14% | 8 | 32% |
| The mother took cod liver oil regularly while she was still breastfeeding | 401 | 29.90% | 7 | 28% |
| The child took cod liver oil daily or often per week | 937 | 69.87% | 14 | 56% |
I. Possible risk factors assessed to see if they increased the risk of food allergy
II. Children with challenge-confirmed food allergy by double blind placebo controlled food challenge with specific possible risk factor.
Table IV. Logistical regression between risk factor and allergic disease
| Risk factor | Sensitized | Positive serum IgE | Positive skin prick test | Asthma | Atopic dermatitis | Rhino-conjunctivitis |
| Mother had preeclampsia | p=0.002; OR=3.42 | |||||
| The child took cod liver oil daily or often per week | p=0.005; OR=0.42 | p=0.010; OR=0.46 | p=0.025; OR=0.39 | P=0.002; OR=2.12 | ||
| Mother smoked during the pregnancy | p=0.021; OR=0.22 | |||||
| Both parents with positive allergy history | p<0.001; OR=2.12 | p=0.004; OR=1.90 | ||||
| Mother with positive allergy history | p=0.001; OR=1.99 | |||||
| Father with positive allergy history | p=0.024; OR=1.58 |
The table shows where significant regression was found between risk factor and allergic disease. Shaded boxes: No statistically significant regression. No significant regression was found between these factors and children's allergic disease if parents did not have a history of allergic diseases.
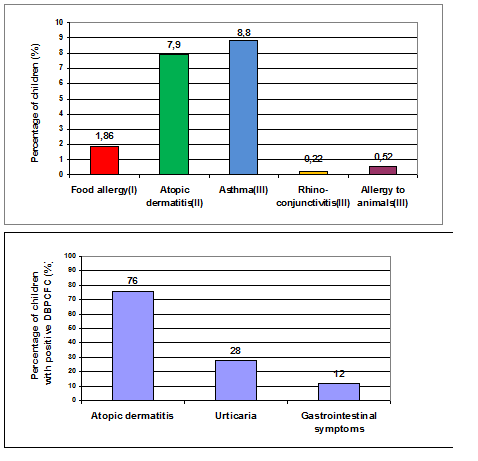
Fig. 1. Symptoms of children that had challenge-confirmed food allergy
The figure shows the symptoms reported by parents of children with challenge-confirmed food allergy.
Fig. 2. Prevalence of allergic diseases in first year of life
- Challenge-confirmed food allergy.
- Based on the assessment of the study's physician.
- Based on questionnaire where parents were asked if their child had been diagnosed by a physician.